La Mirada Real Estate Market Forecast South East La Mirada Neighborhood
South East La Mirada
Six And Twelve-Month Comparison
Prices
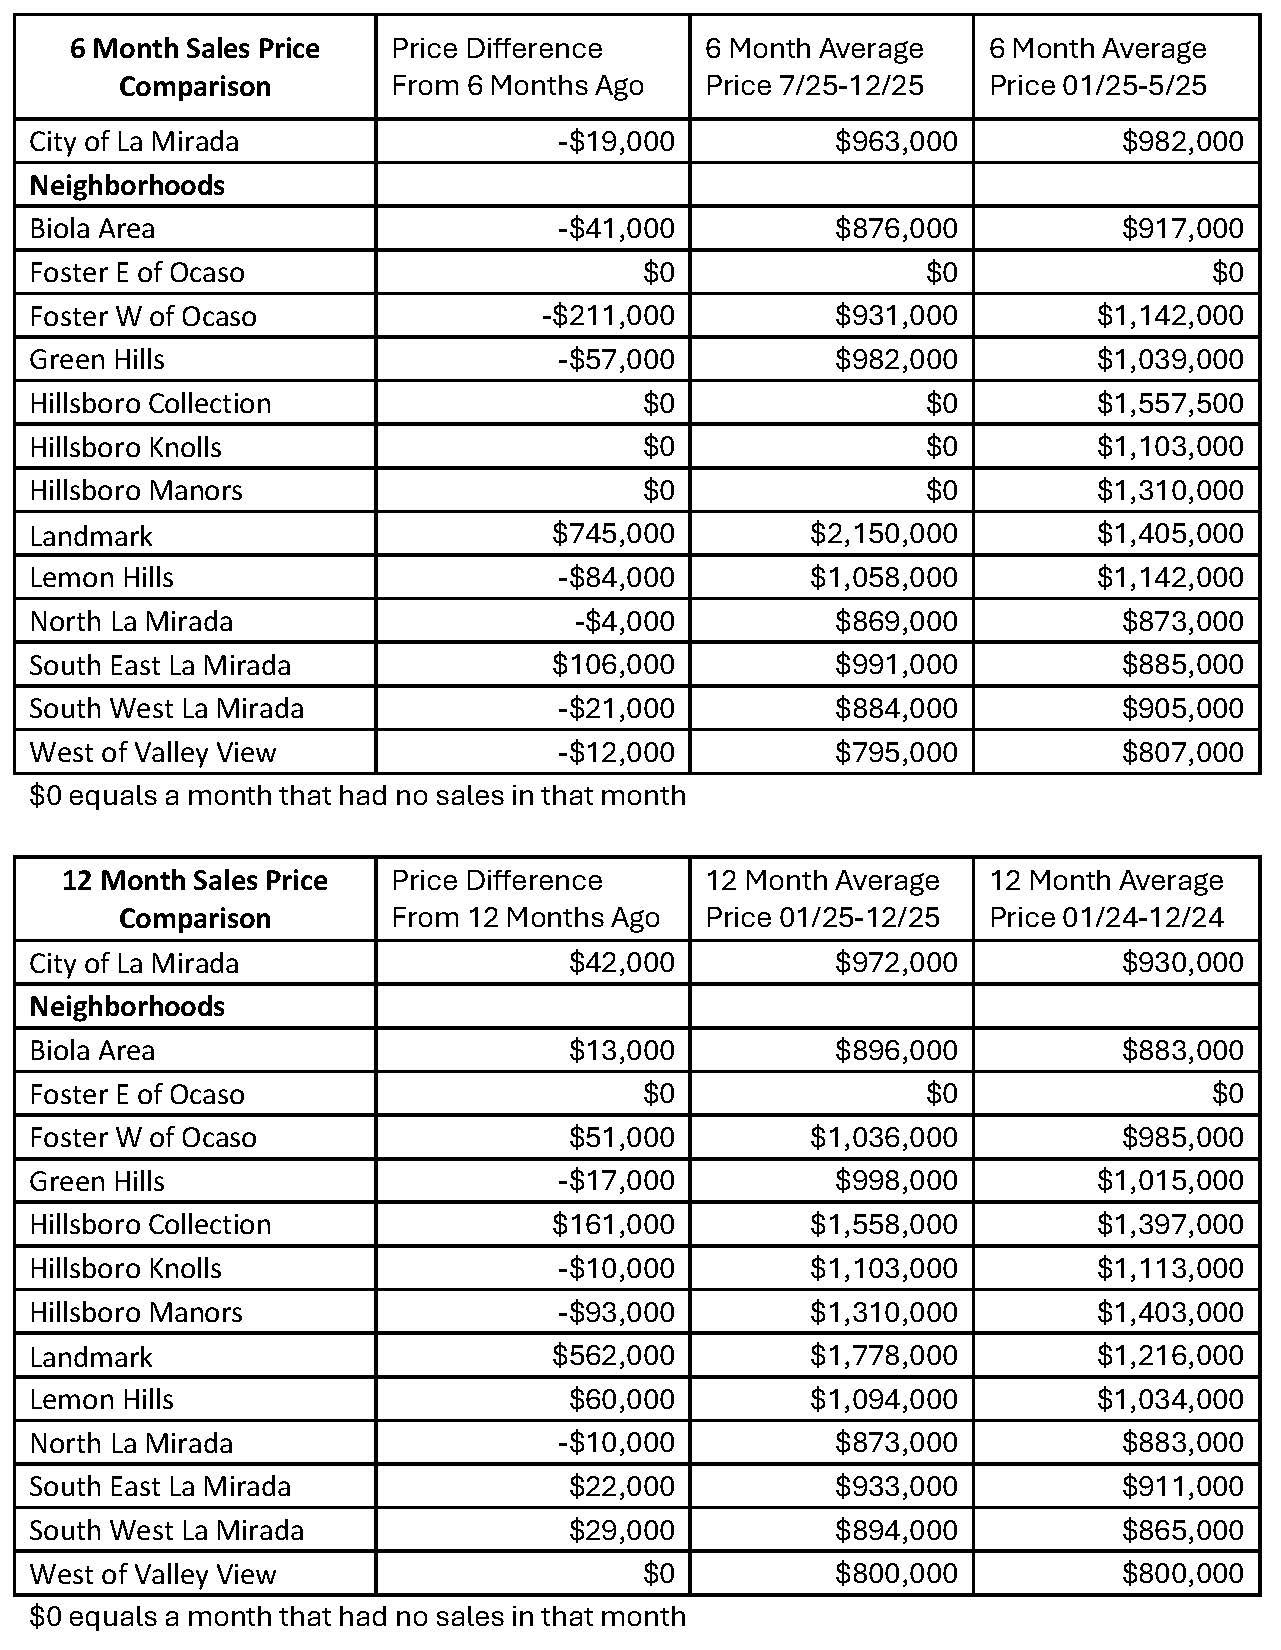
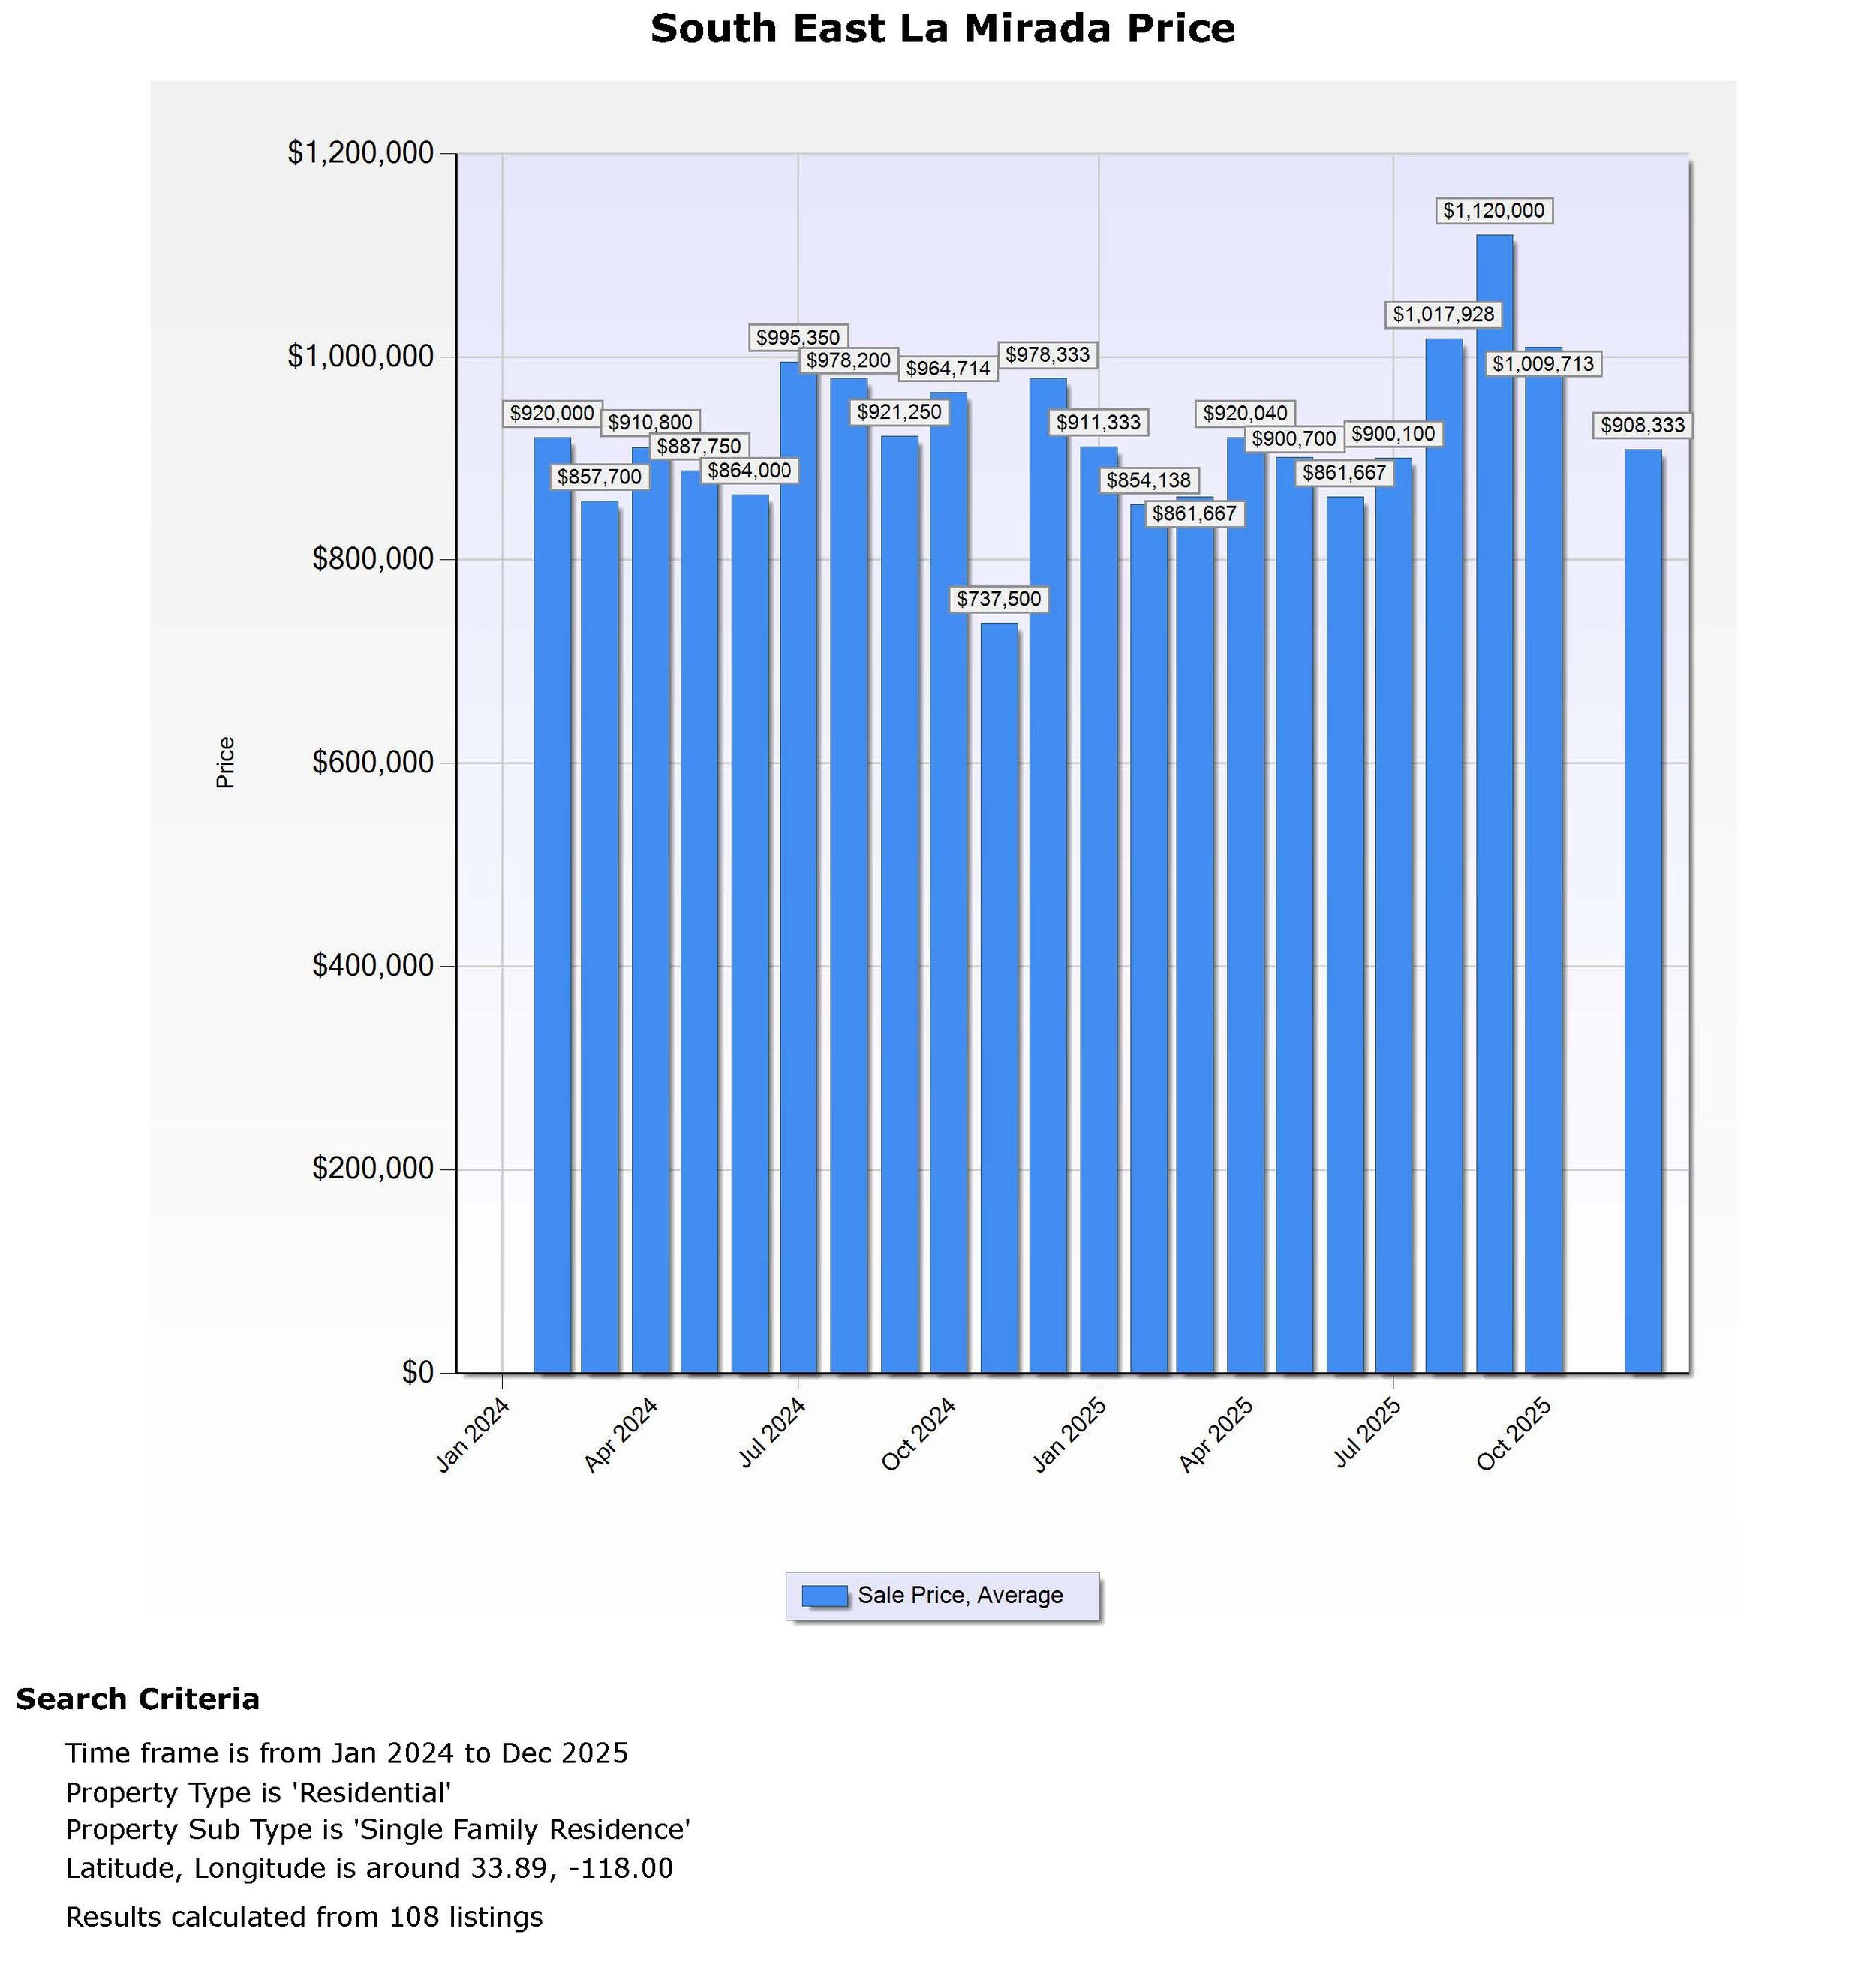
The six-month average price for this neighborhood was $991,000, compared with $885,000 for the six months before that. This gives the South East La Mirada area an average monthly price increase of $106,000 over the last six months. As you can see from the price graph, prices in the South East La Mirada area have remained relatively stable over the previous six months. The lowest monthly average for the last six months was $900,000, and the highest was $1,120,000. This gives us a price spread of $220,000 for the neighborhood in the previous 6 months. The price difference will be due to factors such as property condition, added square footage, an added pool, and location.
The 12-month average price for this neighborhood was $933,000, compared with $911,000 for the previous 12 months. This gives the South East La Mirada area an average monthly price increase of $22,000 over the last 12 months. As you can see from the price graph, prices in the South East La Mirada area have remained relatively stable over the previous 12 months. The lowest monthly average for the last 12 months was $854,000, and the highest was $1,120,000. This gives us a price spread of $266,000 for the neighborhood in the previous 12 months. The price difference will be due to factors such as property condition, added square footage, an added pool, and location.
Sales
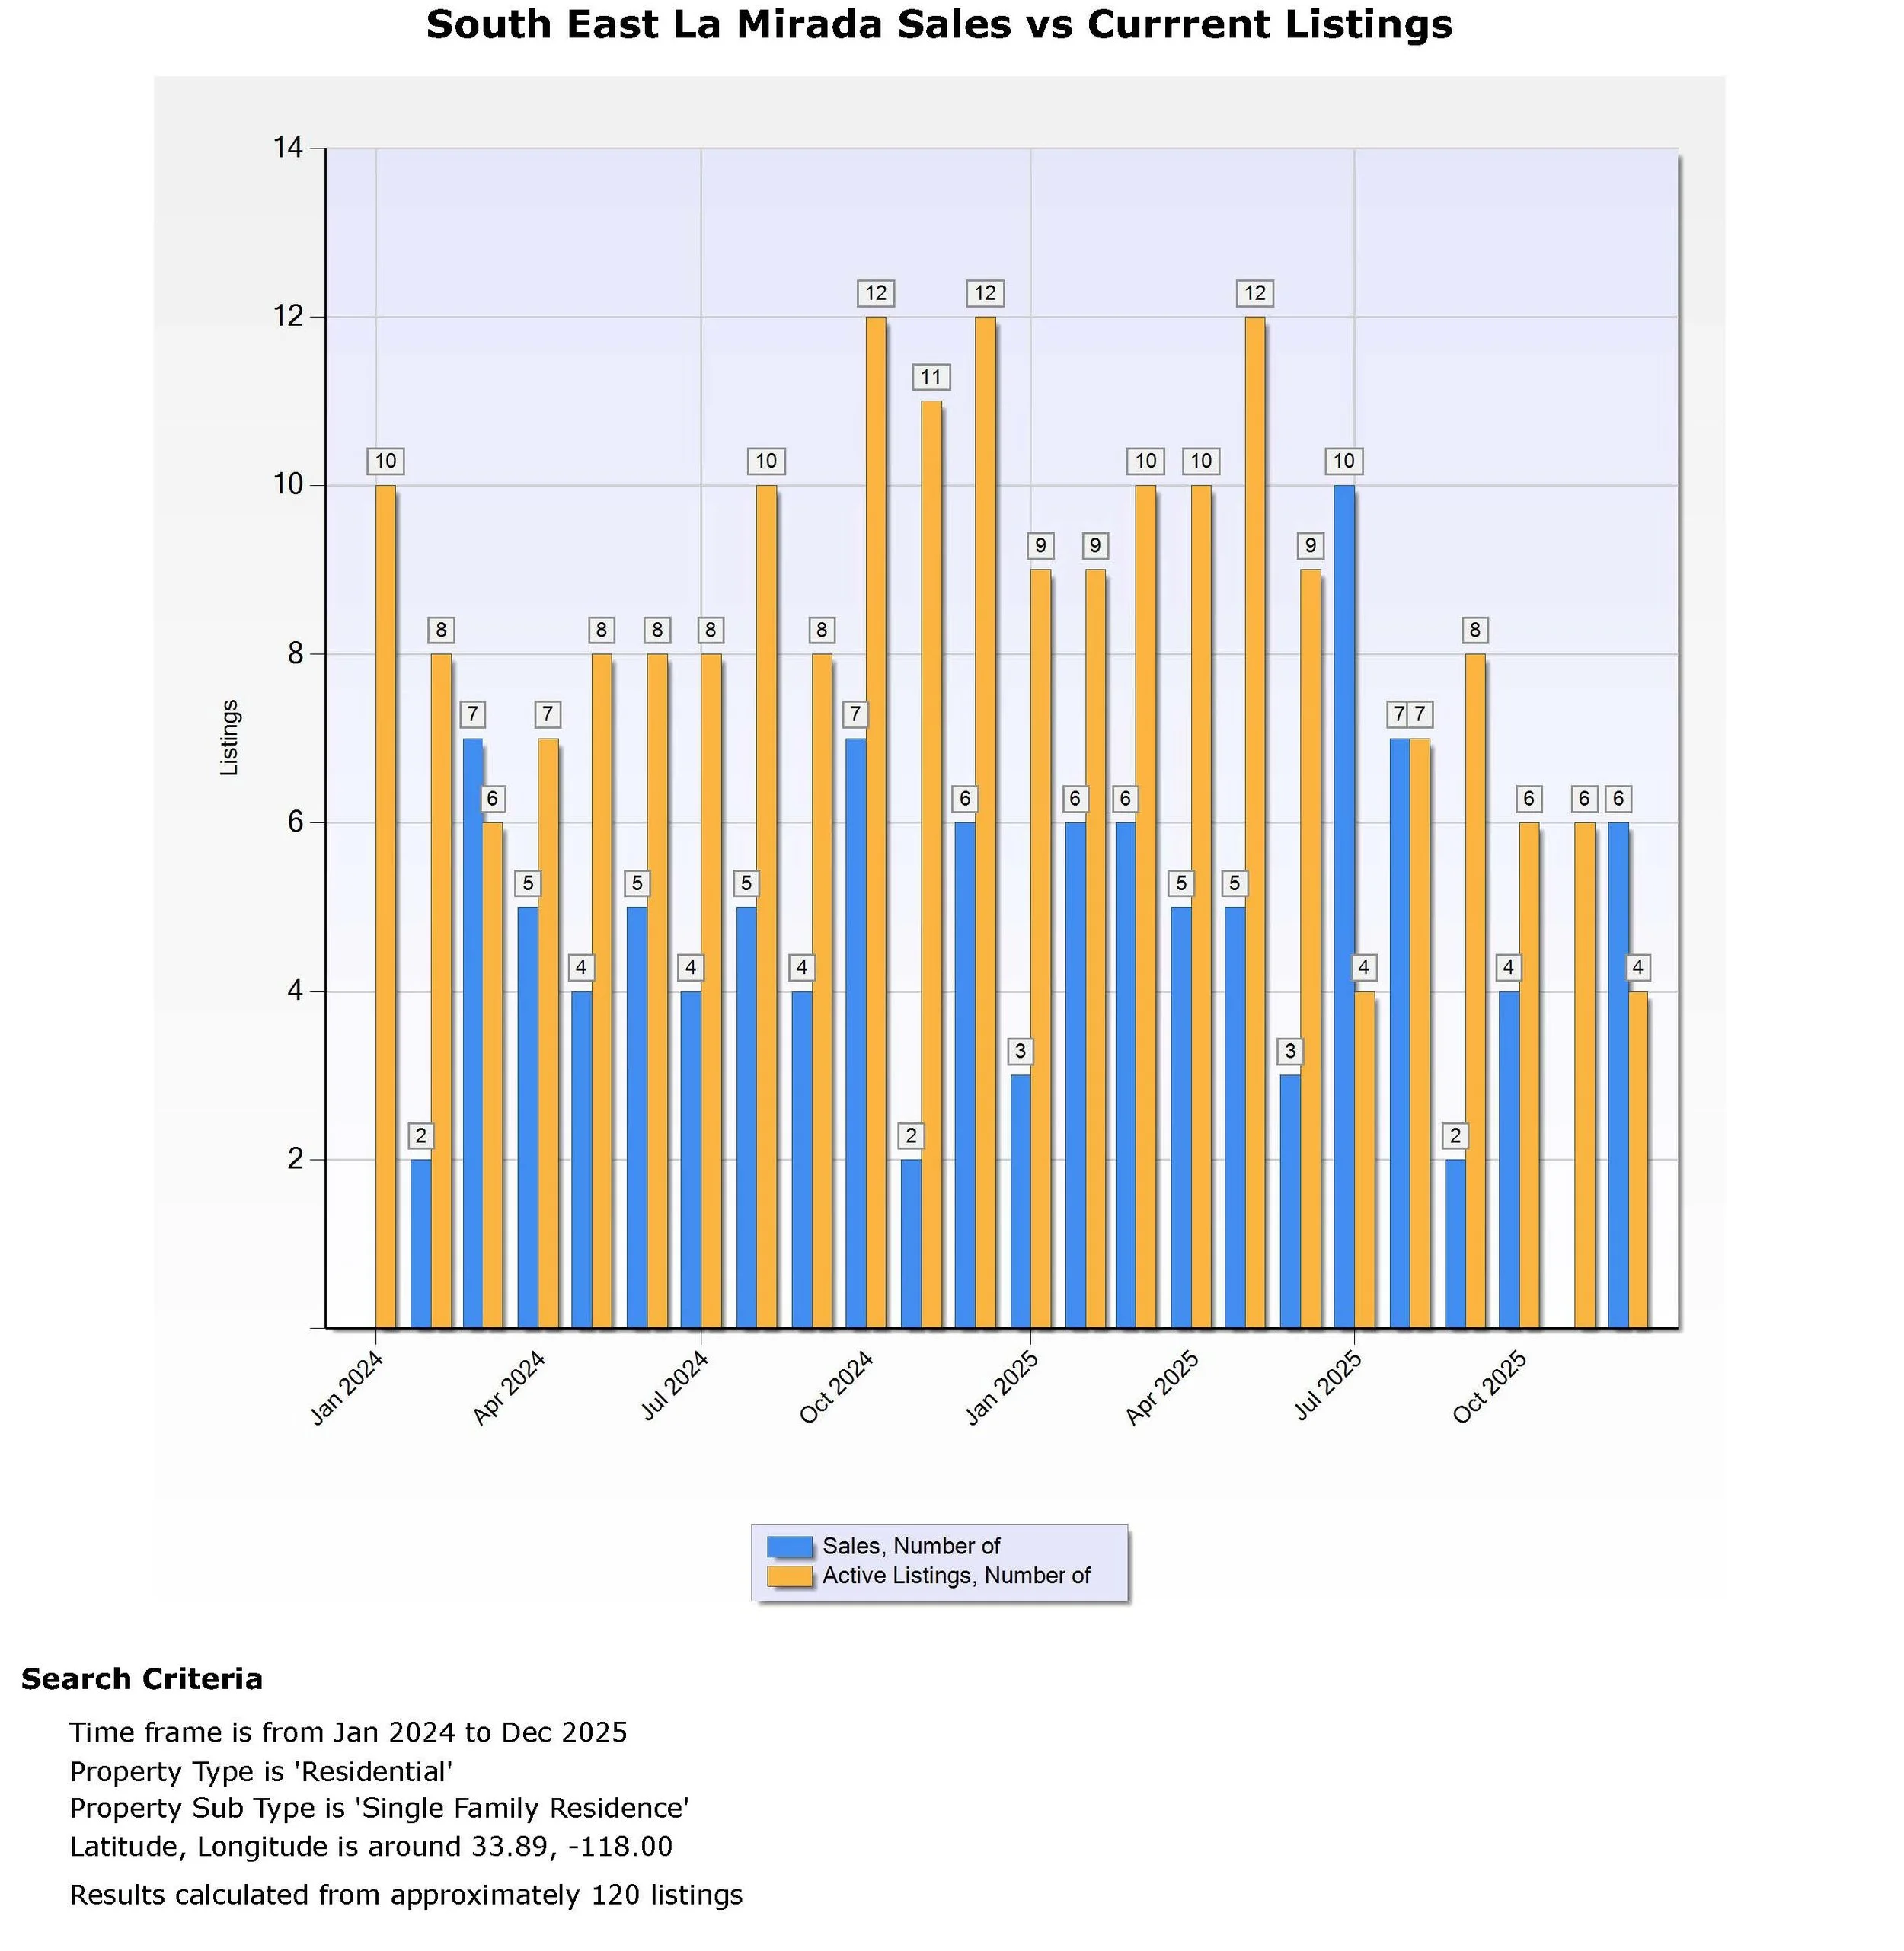
Over the last 6 months, we have had a decrease of 0.9 sales per month and a decrease of 4.0 listings per month. This is based on the current 6-month average of 4.3 sales per month and 5.8 listings per month, compared with the previous 6 months, which averaged 5.2 sales per month and 9.8 listings per month.
Homes are still selling quickly in La Mirada, with an average of 27 days to sell. For the last six months, sales in this neighborhood have averaged 16 days on the market before entering escrow.
Over the last 12 months, we have had an increase of 0.2 sales per month and a decrease of 1.2 listings per month. This is based on the current 12-month average of 4.8 sales per month and 7.8 listings per month, compared with the previous 12 months, which averaged 4.6 sales per month and 9.0 listings per month.
Homes are still selling quickly in La Mirada, with an average of 17 days to sell. For the last twelve months, sales in this neighborhood have averaged 19 days on the market before entering escrow.
Forecast
Overall, South East La Mirada is doing well. Demand for this neighborhood has always been good. It is the center of La Mirada. This neighborhood borders the shopping center, Behringer Athletic Field, the golf course, and Regional Park. It also has La Pluma Elementary School in the middle of the neighborhood, and it is next to La Mirada High School.
Prices in the area will continue to correct over the next few months, but should stabilize or possibly rebound by summer or towards the end of the year. With strong demand for the city and the area and with a shortage of listings, barring any economic problems, the South East La Mirada Area will do well this year.
If you would like a detailed analysis of your home’s current market value
You can call, text, or email me.
Cell 714 342-7270
Email tysutherland@firstteam.com
I will send you a detailed Market Analysis of your home. This analysis will take into account the condition of your home, its square footage, any improvements, and any special features.
Let me build a customized home-selling experience to meet your needs
If you are thinking of selling, I will also send you information on our EXCLUSIVE INDUSTRY-LEADING Buyer Delivery System. Our Approach Generates Motivated Buyers and Drives Demand for Your Home, Resulting in the Quickest Sale at the Highest Price for our Clients.
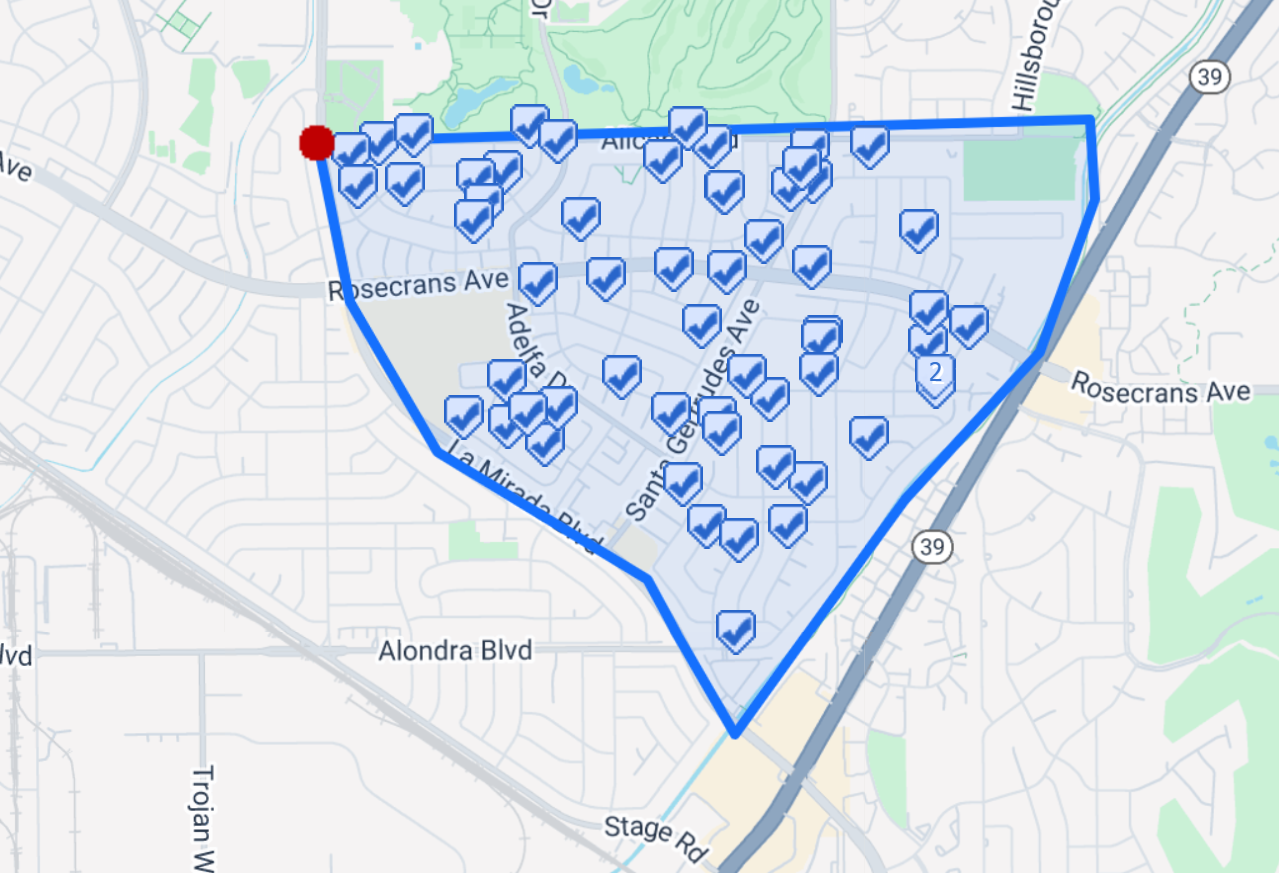
A map of current active listings and sales in South East La Mirada for the last 12 months that was used for analysis.
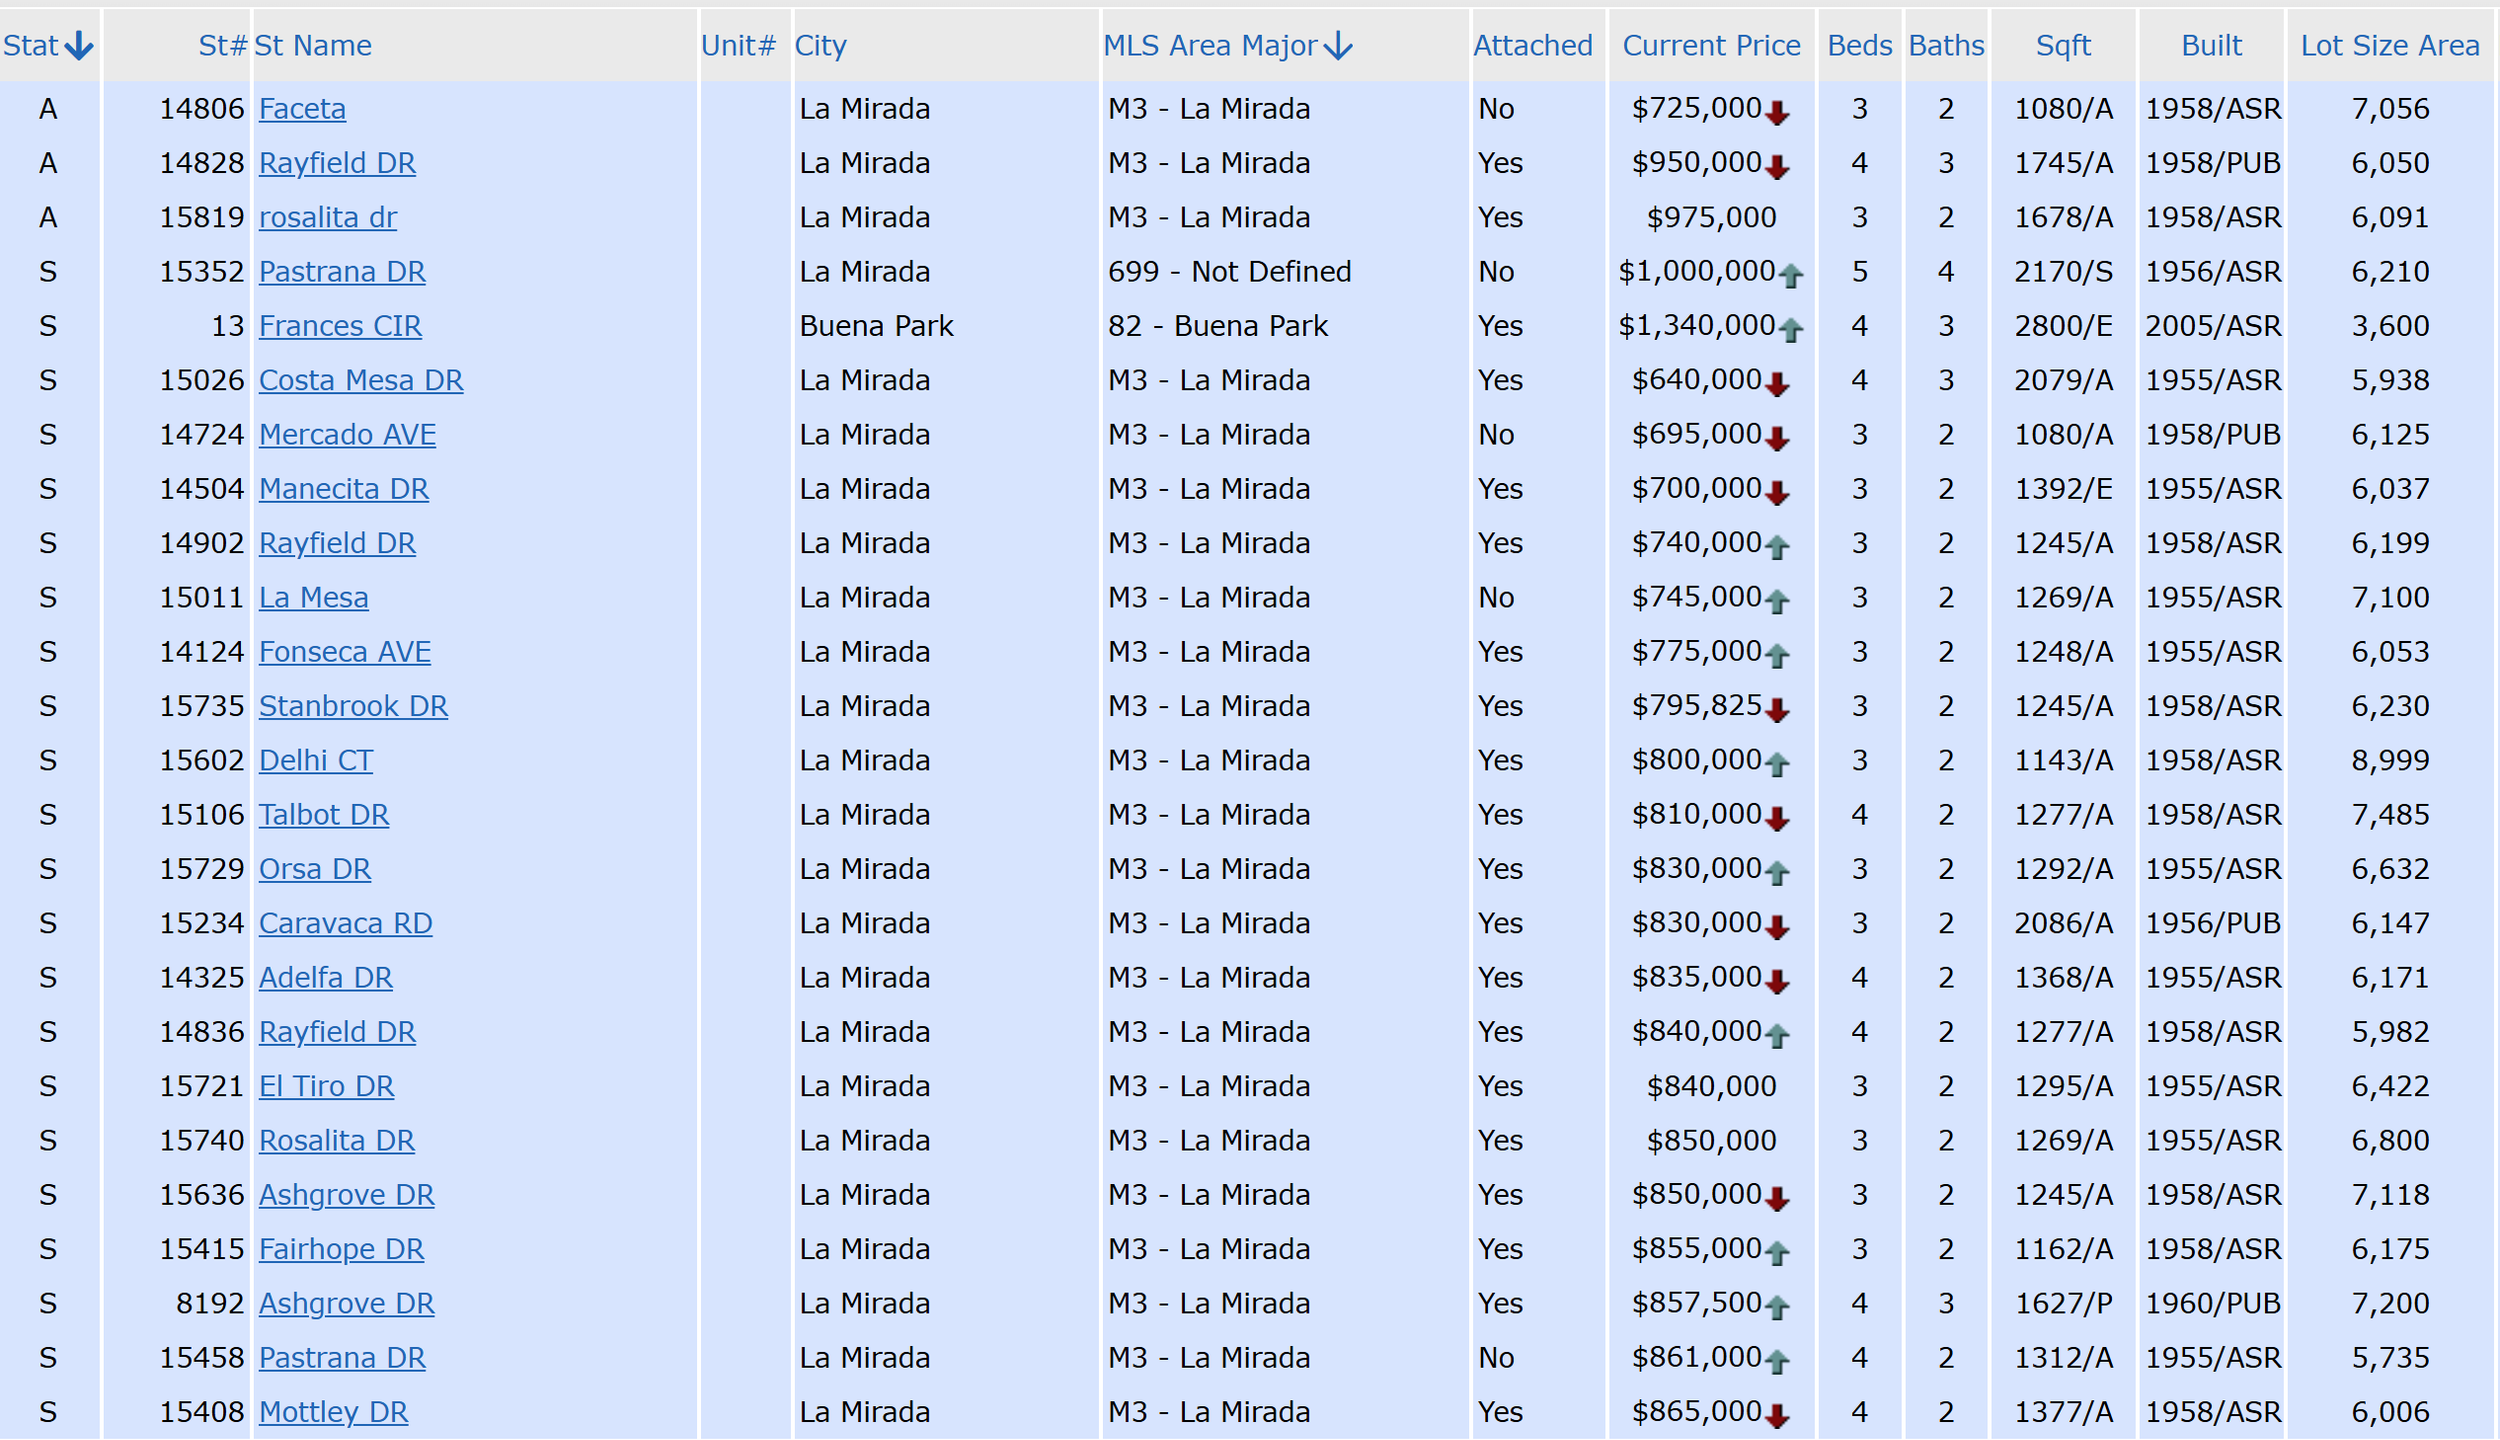
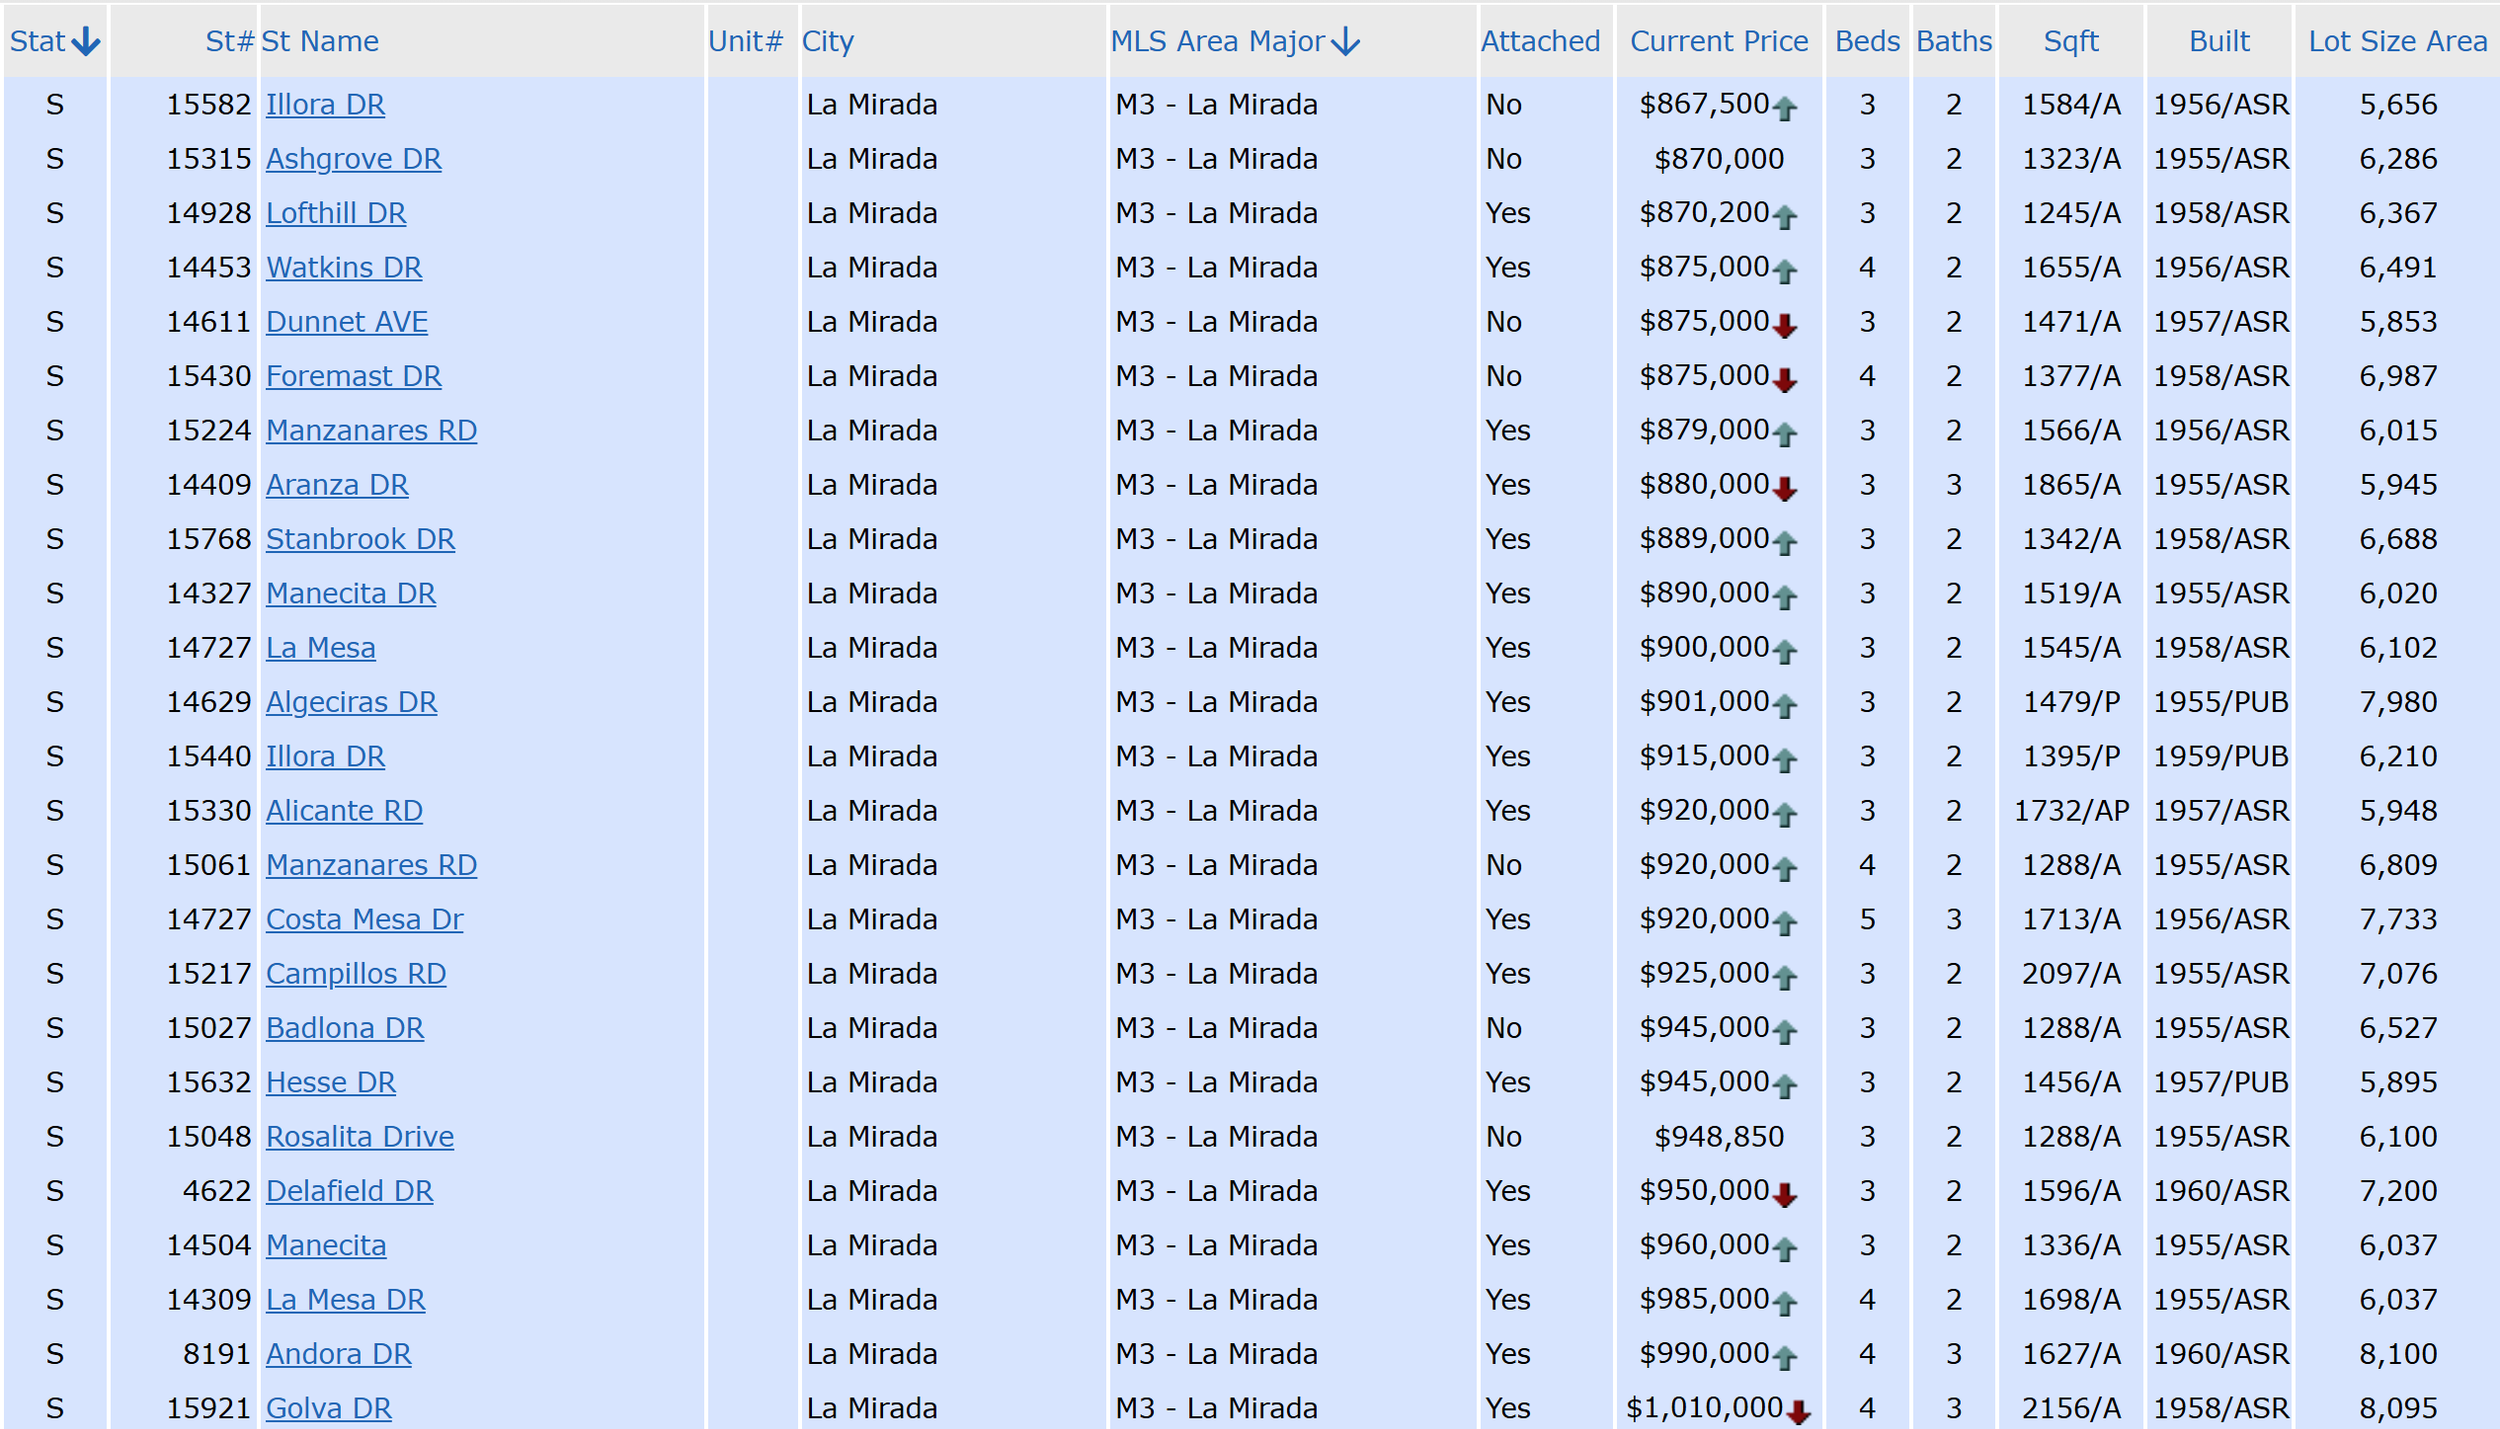
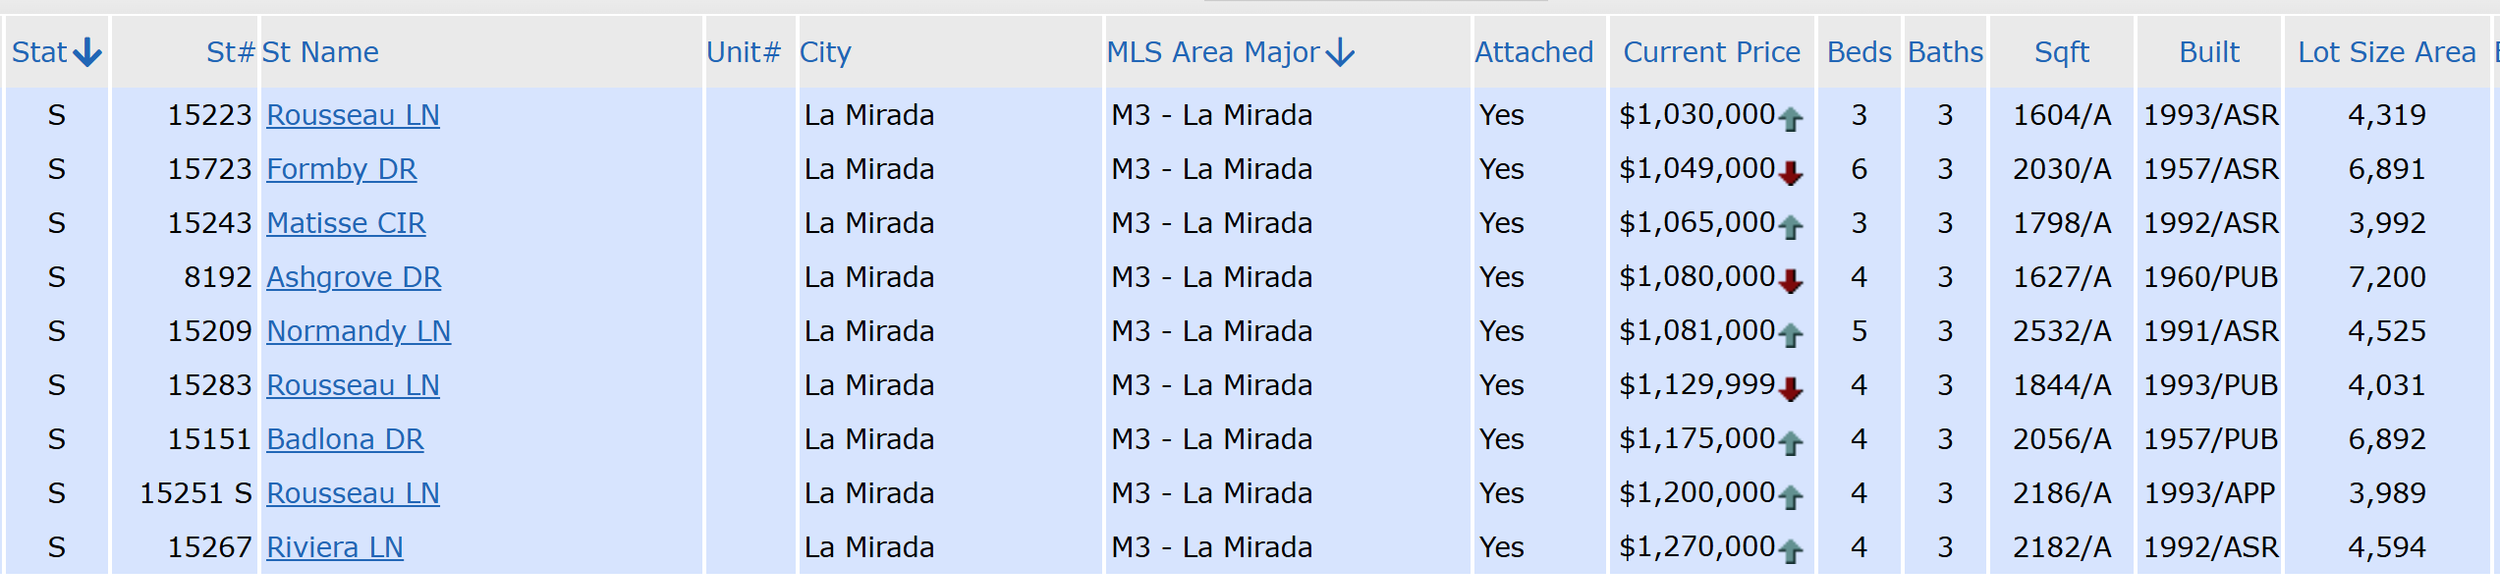
The table below lists the prices used in the South East La Mirada analysis over the past twelve months.
South East La Mirada Twenty-Four-Month Price Graph
Demand Graph Sales vs Listings
South East La Mirada compared to the city of La Mirada and the Individual La Mirada neighborhoods
Here is a way for you to track how the city and your neighborhood have progressed over the last six and twelve months, and how individual neighborhoods are progressing compared to yours.