

La Mirada Real Estate Market Trends For The Landmark Neighborhood
Landmark neighborhood Six And Twelve-Month Comparison
Prices
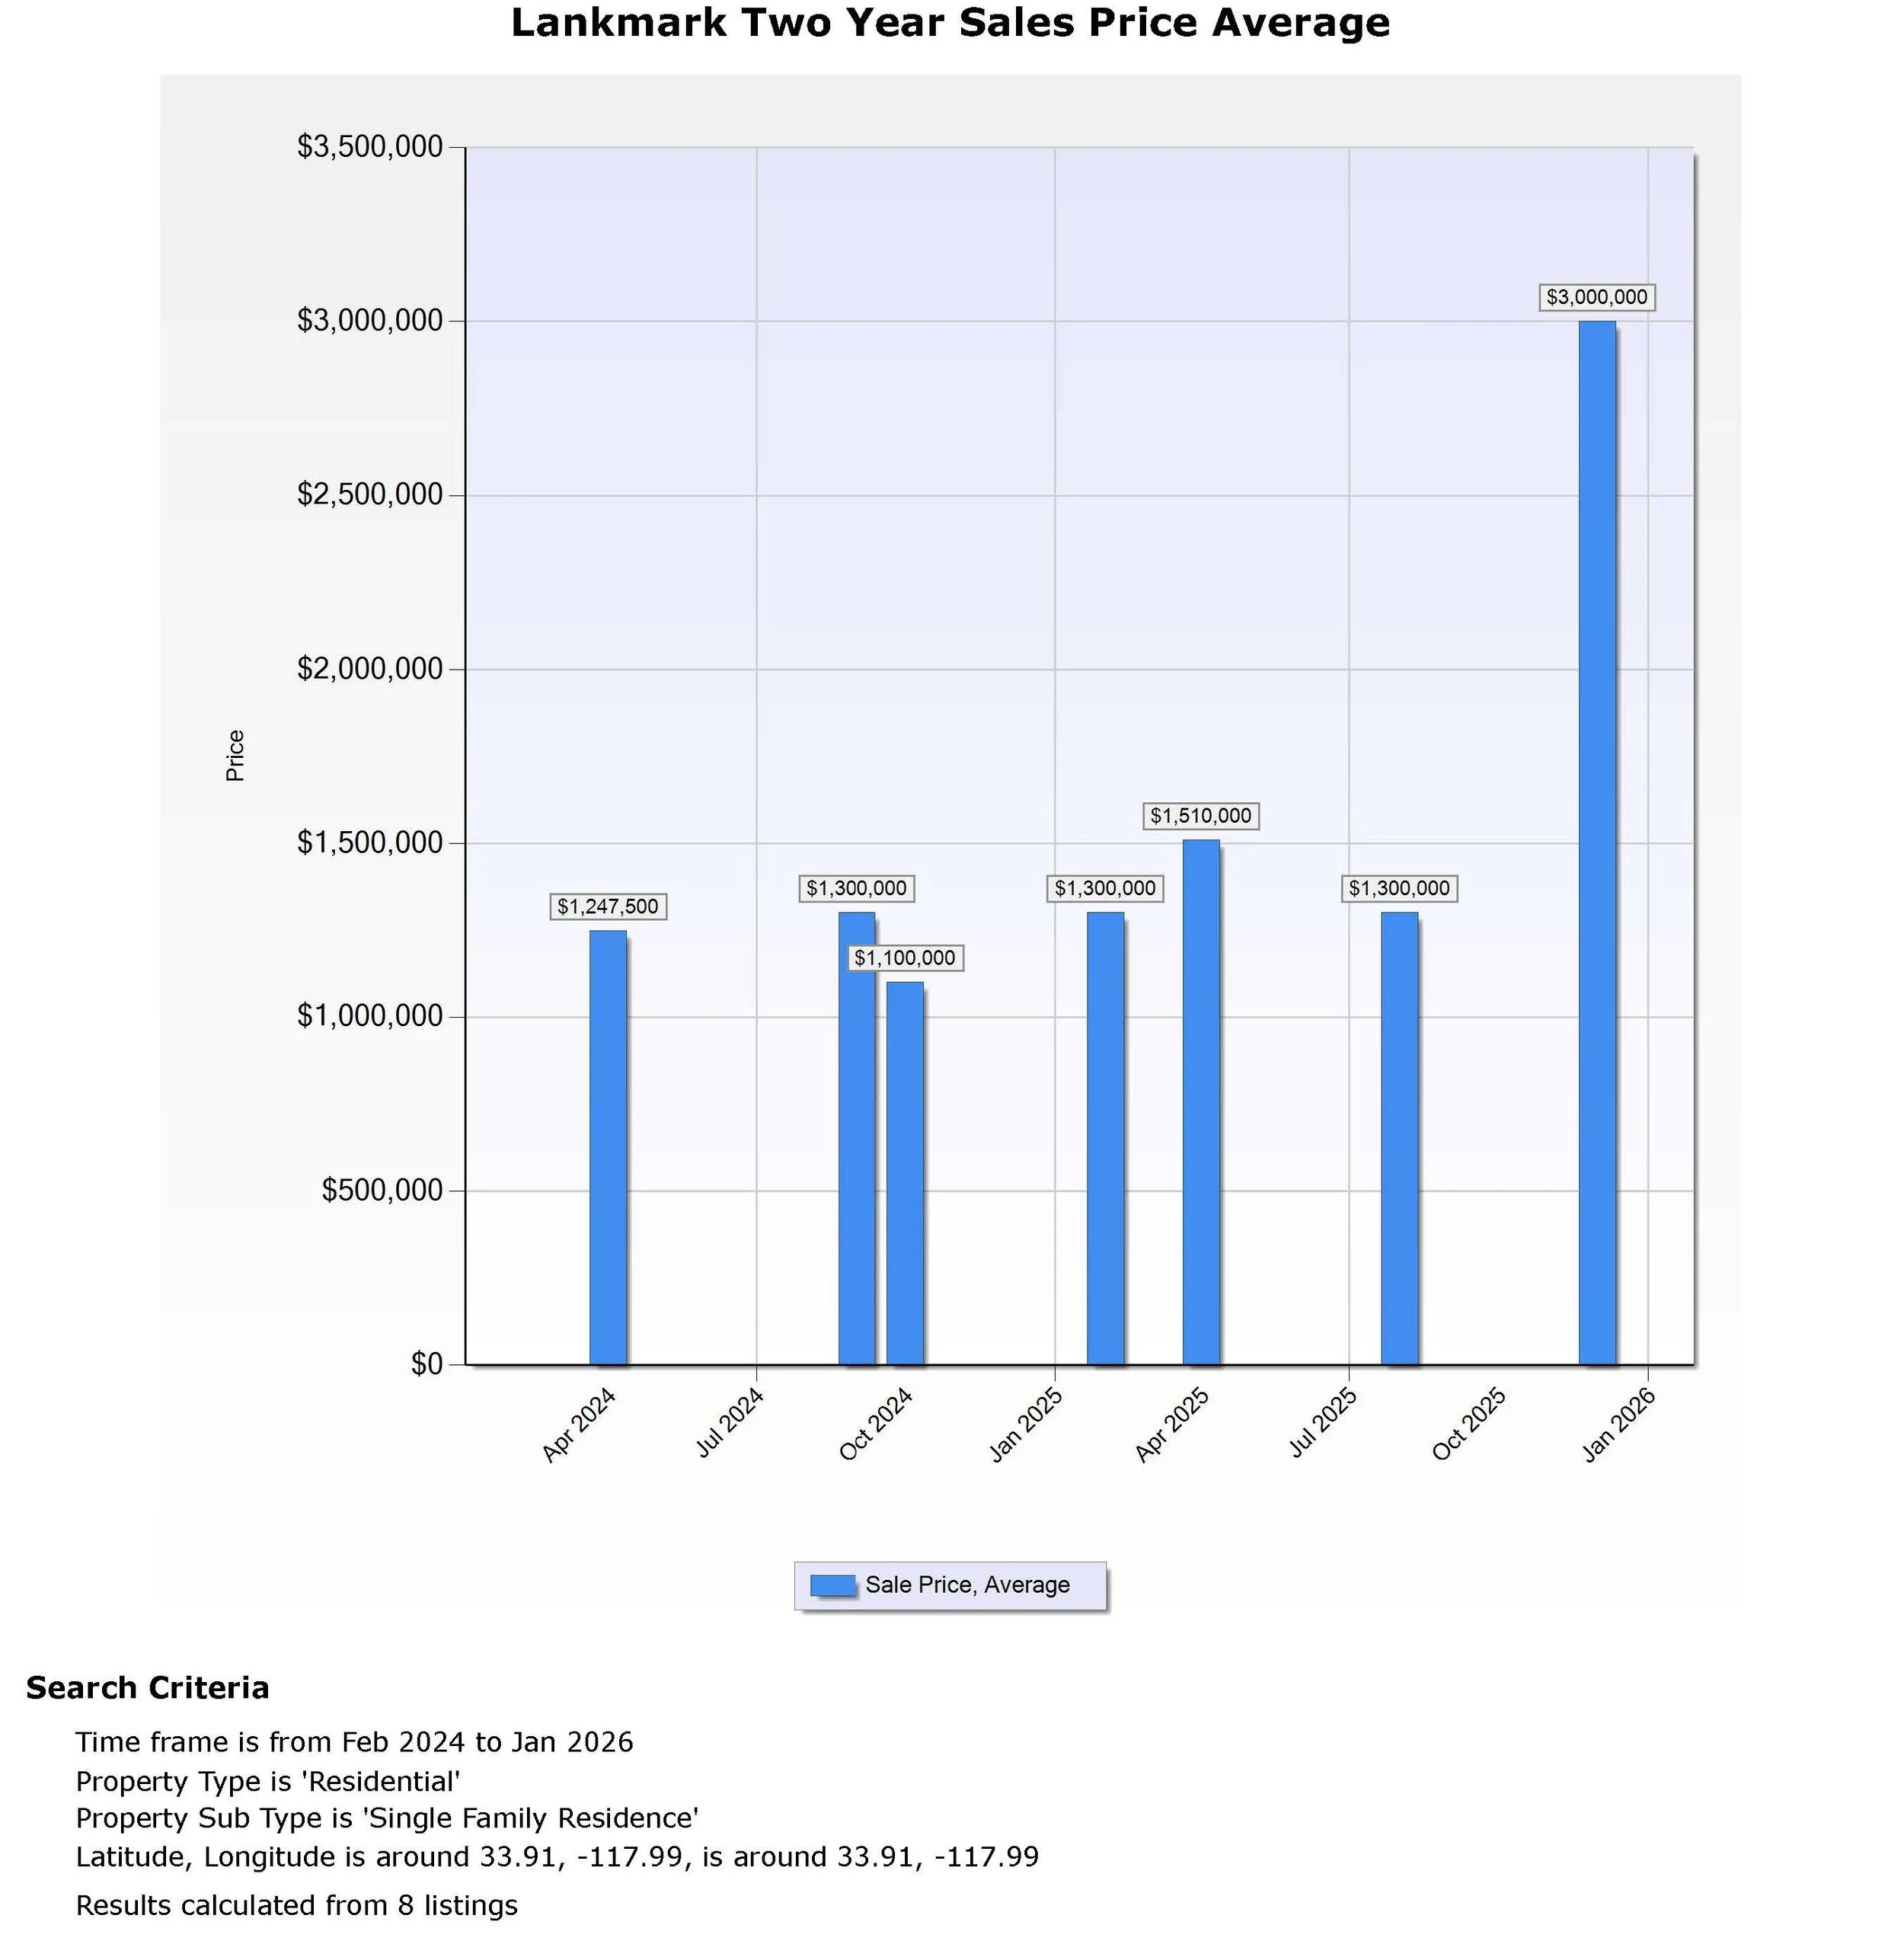
Over The Last six-months the average price for this neighborhood was $2,150,000, compared to$1,405,000 in the preceding six months. This results in an average monthly price increase of $745,000 in the Landmark neighborhood over the last six months. As you can see from the graph below, prices in the Landmark neighborhood have remained relatively stable over the last six months. The lowest monthly average for the last six months was $1,300,000, and the highest was $3,000,000. The house that sold for $3 million has thrown the averages and the spread way off. This yields a $1,700,000 price spread for the neighborhood over the last 6 months. The price difference is typically due to factors such as property condition, added square footage, an added pool, and location.
Over The Last 12-months the average price for this neighborhood was $1,778,000, compared to $1,216,000 for the previous 12 months. This results in an average monthly price increase of $562,000 in the Landmark neighborhood over the last 12 months. As you can see from the graph below, prices in the Landmark neighborhood have remained relatively stable over the last 12 months. The lowest monthly average for the last 12 months was $1,300,000, and the highest was $3,000,000. A house sold for $3 million, which significantly affected the averages and the spread. This yields a $1,700,000 price spread for the neighborhood over the last 12 months. The price difference is typically due to factors such as property condition, added square footage, an added pool, and location.
Price Summary
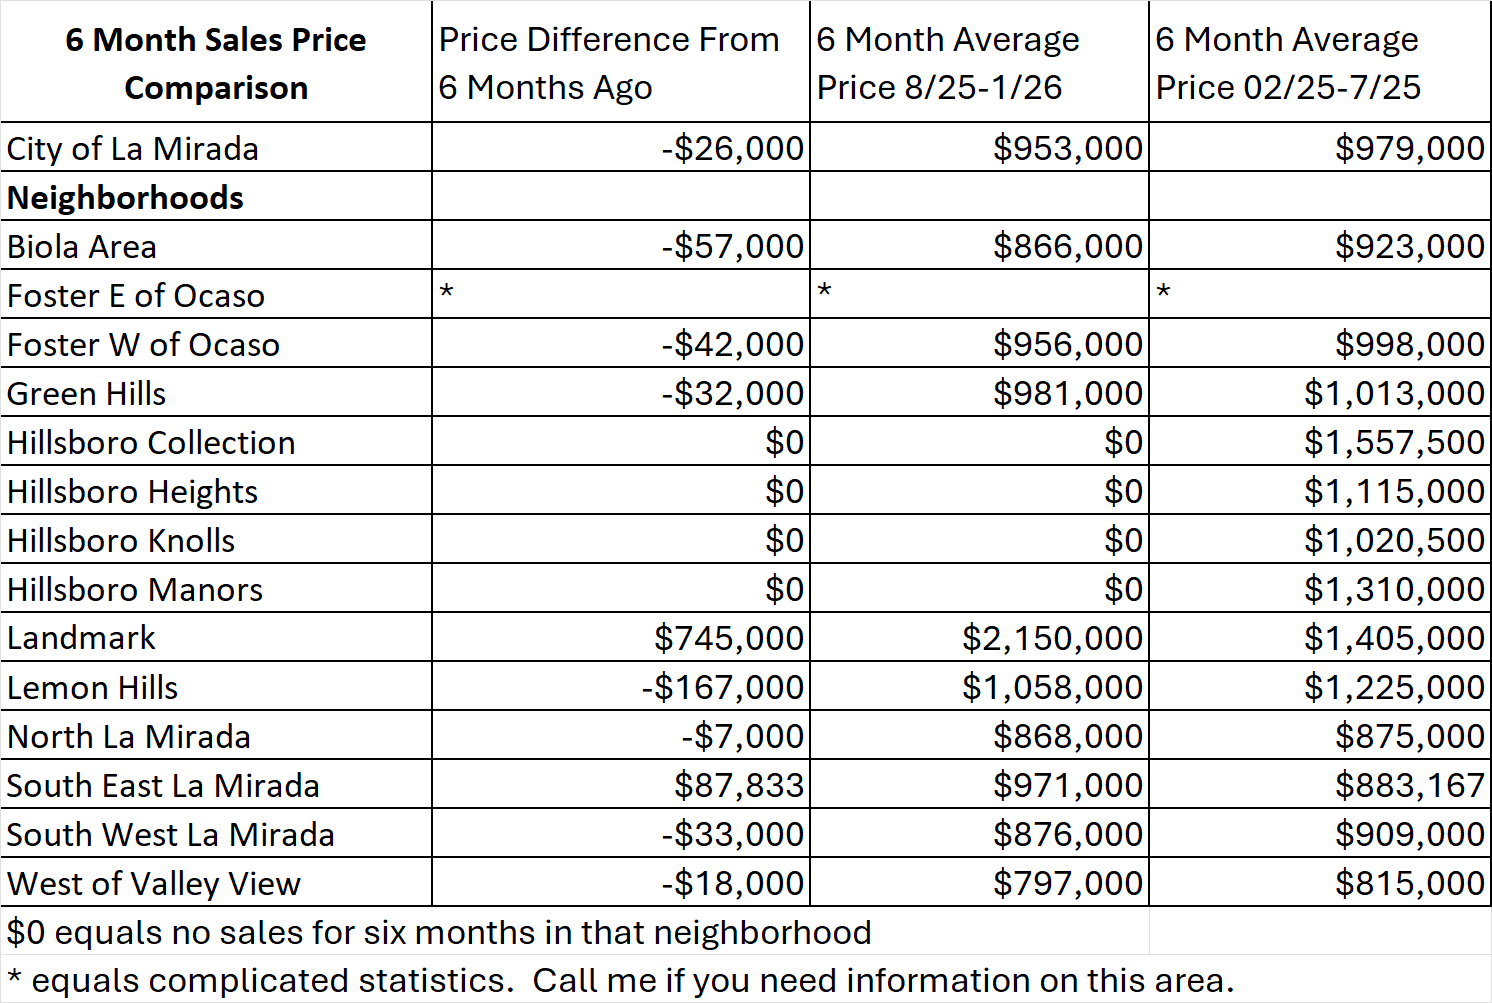
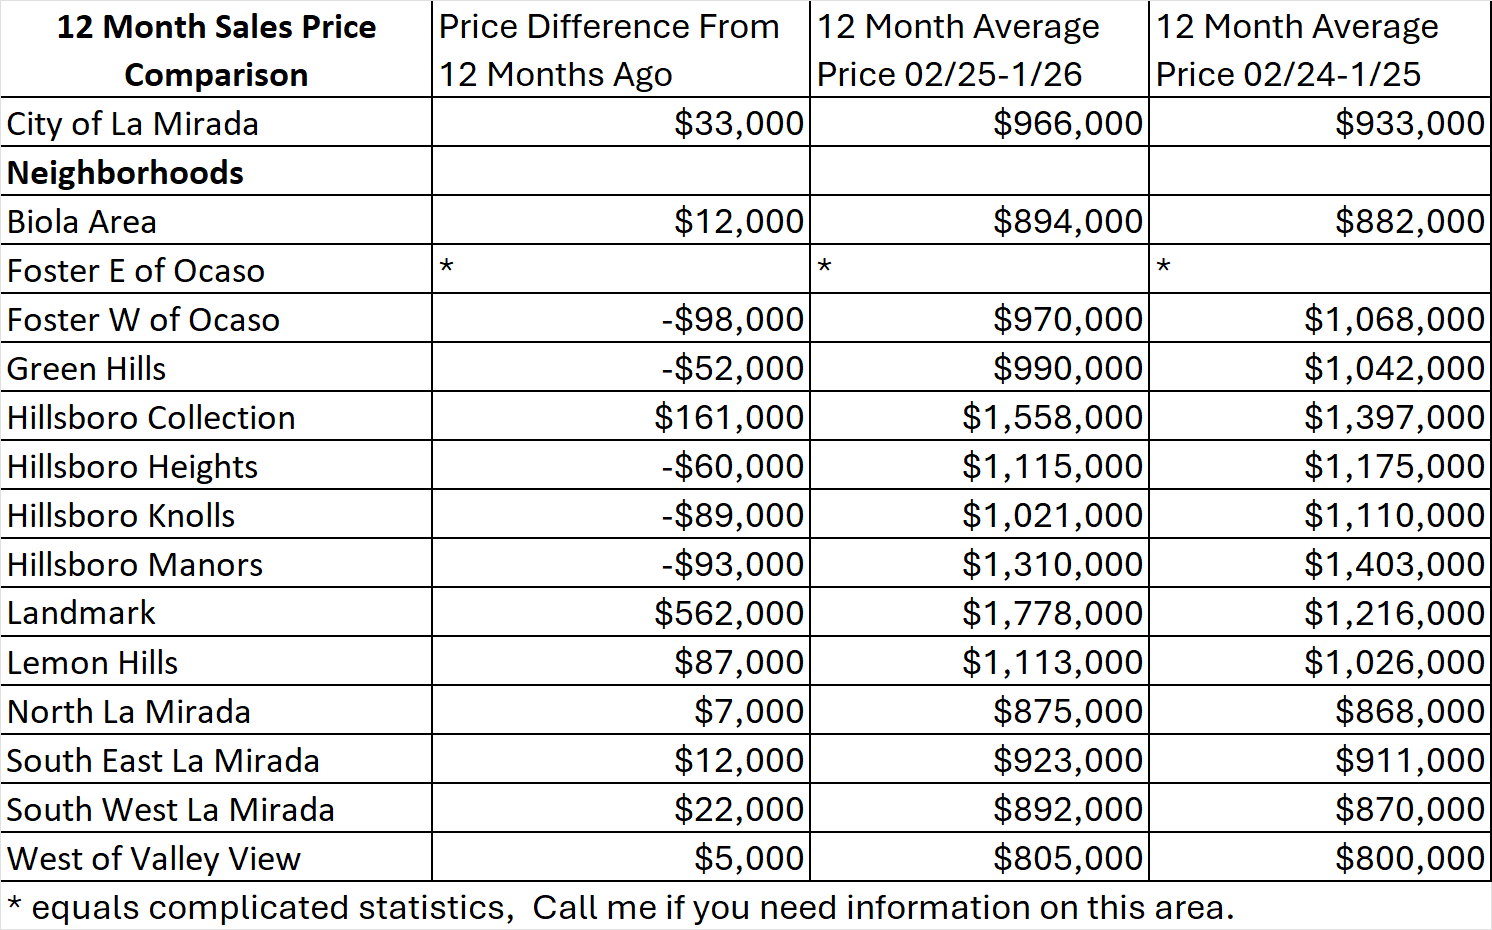
In the Landmark Neighborhood, prices have increased by $745,000 over the last 6 months. When we examine the 12-month average, prices have increased by $562,000. However, this increase will be reduced over the next few months. When we compare the Landmark Neighborhood to the neighborhoods for which we have stats. 4 of them had no sales in the last 6 months. 6 had a decrease in their average price over the last 6 months. 3 had an increase in their average price over the last 6 months. This resulted in a citywide average loss of $26,000 over the last 6 months. Like most cities in the surrounding area, La Mirada prices are going down.
See the tables at the end of this report to see each neighborhood’s increase or decrease
Sales
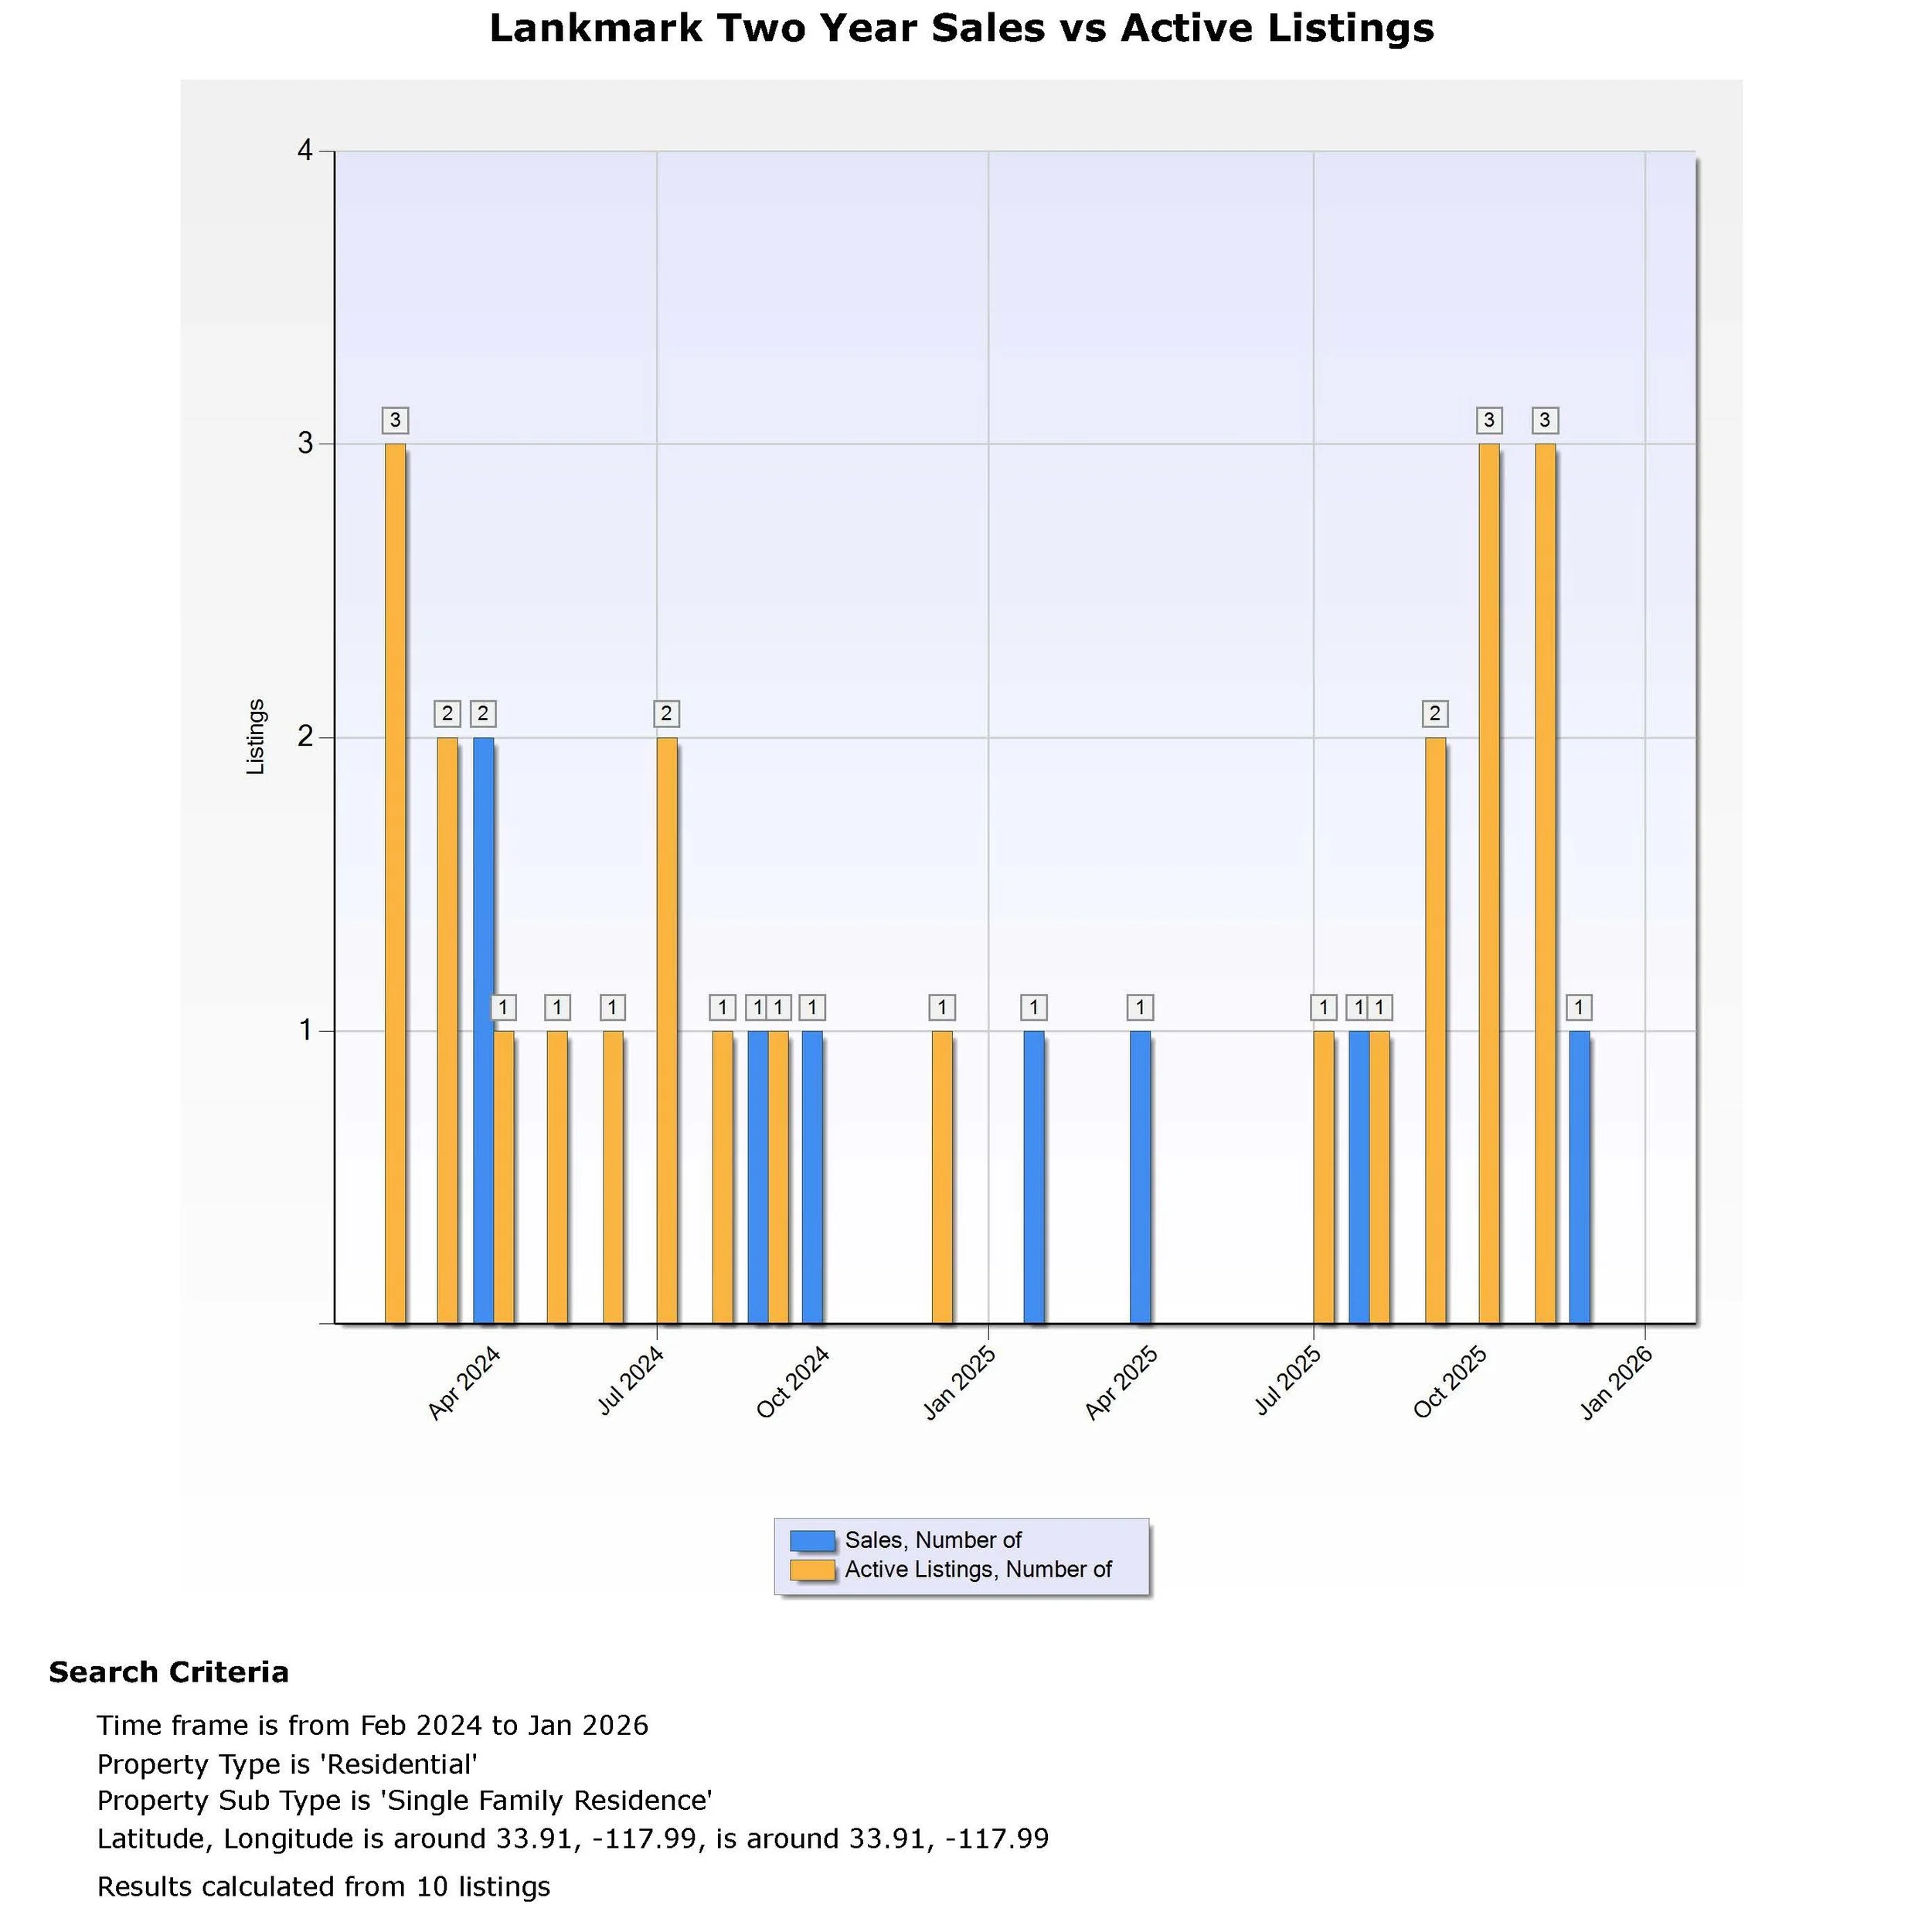
Over the past 6 months, we have observed a 0.0 decrease in monthly sales and a 1.3 increase in monthly listings. This is based on the current 6-month average of 1.0 sales and 2.3 listings per month, compared to the previous 6 months, which averaged 1.0 sales and 1.0 listings per month.
In the last 6 months, homes in La Mirada have sold quickly, with an average of 25 days before entering escrow. For the last 6 months, sales in this neighborhood have averaged 34 days on the market before entering escrow.
Over the last 12 months, we have had an increase of 0 sales per month and a decrease of 0.6 listings per month. This is based on the last 12-month average of 1.0 sales and 2.0 listings per month, compared to the previous 12 months, which averaged 1.0 sales and 1.4 listings per month.
In the last 12 months, homes in La Mirada have sold quickly, with an average of 22 days before entering escrow. For the last 12 months, sales in this neighborhood have averaged 26 days on the market before entering escrow.
Forecast
Overall, demand in the Landmark neighborhood is very strong. The price increase is attributable to high demand in this area. Demand for this area has always been strong and is expected to remain so, driven by the neighborhood's appeal. Most of the homes in this tract have been updated. Making this tract similar to a tract of homes in Orange County, but at better prices than you can get in Orange County. It is also located near sports fields for children and the La Mirada Golf Course.
Prices in the area will continue to correct over the next few months, but should stabilize or possibly rebound by summer or towards the end of the year. With strong demand in the city and surrounding area and a shortage of listings, barring any economic problems, the Landmark neighborhood will do well this year.
Thinking of Selling?
For most people, selling their home is their biggest Financial decision. When choosing an agent to help you sell, every agent you talk to will tell you the same things, and they are #1. But there is only one #1 Firstteam! All I ask is that you show me your home and let me spend 20 minutes explaining how we are different from any other company you may speak with. Our difference enables us to consistently outperform other companies and secure the highest price for our clients. Start your biggest decision with your best decision. Talk to Ty.
I will make you 2 promises: 1. No sales talk, just an informative conversation. 2. You won’t regret your decision.
Why not use the Best?
Ty Sutherland has over 30 years of experience in selling La Mirada homes for top dollar
Firstteam Real Estate is #1 in selling homes for top dollar in Southern California, for the last 15 years
Call, text, or email me.
Cell 714 342-7270
Email tysutherland@firstteam.com
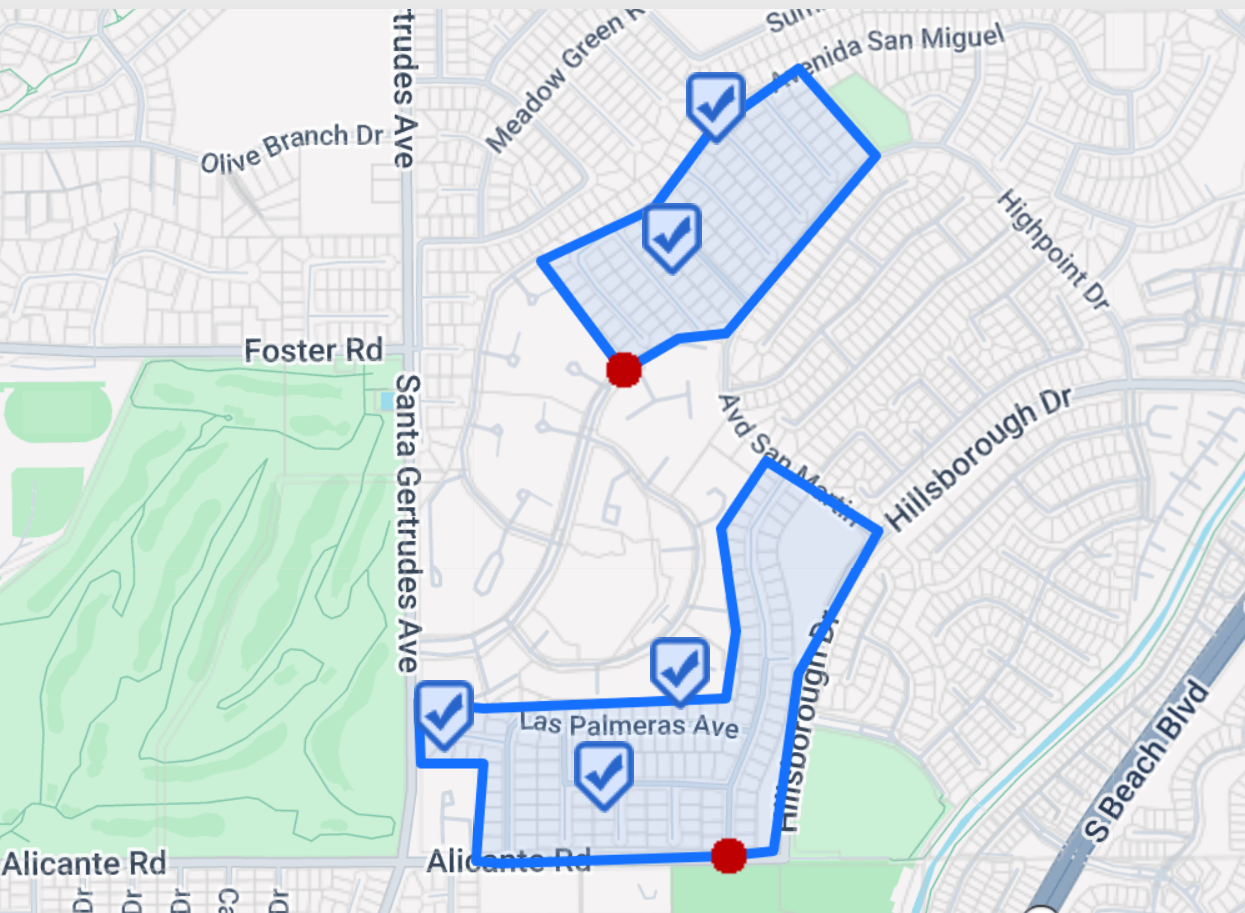
A map of Landmark's neighborhood, current active listings, and sales over the last 12 months was used in this analysis
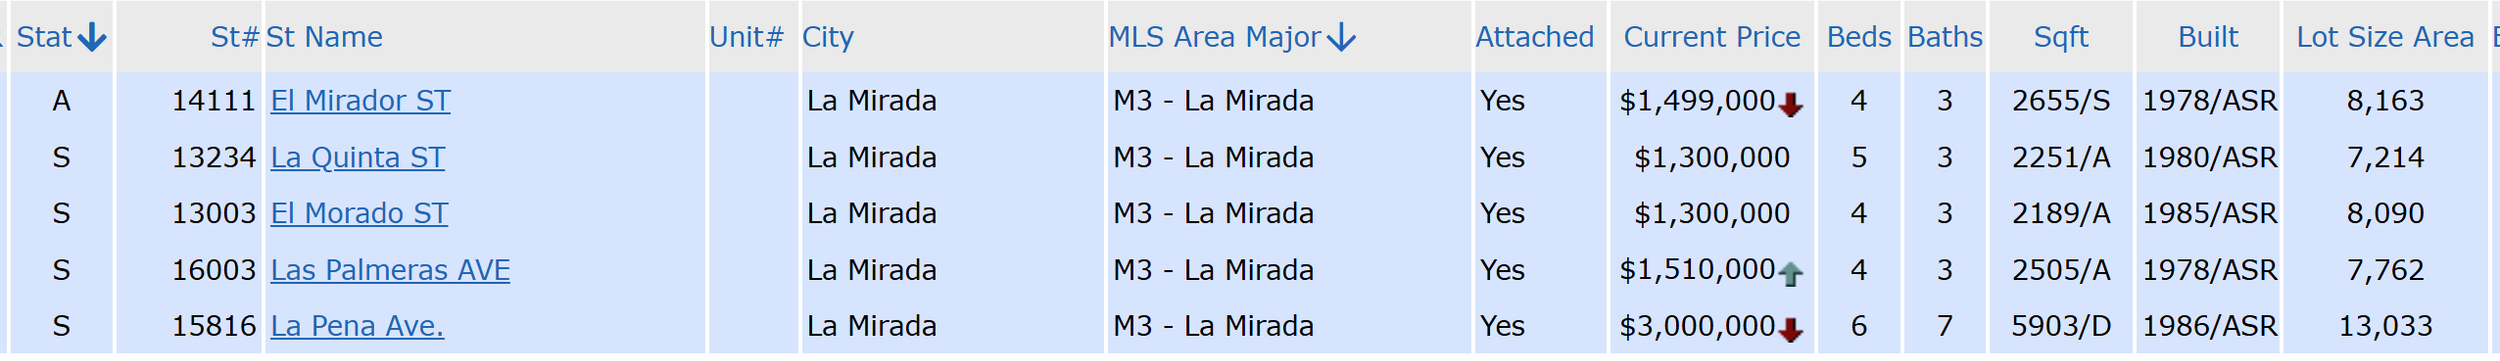
The table below lists the prices used in the Landmark analysis over the last six and 12 months.
Landmark’s neighborhood: Twenty-Four-Month Price Graph
Landmark’s neighborhood Twenty-Four-Month Demand Graph: Sales vs Listings
Landmark compared to the city of La Mirada and the Individual La Mirada neighborhoods
All data is from the CRMLS