

Fourth Quarter 2024 0 - $900,000 Market Report
La Mirada Real Estate Market Trends
Every three months, I will provide a detailed analysis to update you on the La Mirada Real Estate Market. To do this, I will create detailed quarterly market data tables. These tables will consist of data covering Market Prices, Price per Square Foot, Sales vs. Active Listings, and Days On Market. The data to create these tables will come from the Realtor multiple listing service. This report will have three categories: the overall market, 0 - $900,000, and $900,000 plus.
The following analysis is a detailed but easy-to-understand examination of these market trends. I will start with a market summary. If you want a more detailed look at the data, I have provided the data tables with a breakdown of the table numbers for this price range.
If you want to know what your Home is worth using this data, contact me for a more detailed market analysis considering the number of Bedrooms, Bathrooms, Square Feet, Lot size, Condition, Views, and location.
La Mirada Real Estate Market Summary for the 0 - $900,000 price range
La Mirada is doing well. Prices in this price range have continued to increase slowly in the long run. In many areas in Southern California, prices have remained the same for the last 1 to 2 years. Inflation is lower but not low enough for the feds to decrease mortgage rates. Lower rates and housing demand are the key to keeping prices increasing. Rates should go down in 2025, but I don’t think we will have a big drop. So, we can’t depend on mortgage rates going down to help us with prices. However, La Mirada is still affordable compared to many areas in Orange County, and La Mirada borders Orange County. So, the people who can’t afford Orange County will continue to move into La Mirada. This will help keep the demand for La Mirada up. Which will help keep La Mirada prices up.
The data numbers from the tables below show us that the economic influences of higher interest rates due to inflation have not affected prices in a negative way in the last 2 years. In this price range, in the fourth quarter of 2024, we had an average price of $816,000. We are up $43,000(6%) from 2 years ago and $4,000(1%) from a year ago. How much more can we go up in this price range in this economy? We should continue to have a good real estate market in La Mirada because of the demand for the city. Prices in this price range have remained the same for the last year. And days On The Market is up 39% from 1 year ago. This may indicate that the La Mirada Market is starting to slow down. If the new administration will help with inflation so mortgage rates go down, it will help us. We will have to wait a few quarters to see how their policies affect interest rates.
The support data shows that Price Per Square Foot has followed prices up. We are currently at $599 compared to $505 two years ago and $550 a year ago. Sales have stayed almost the same over the last two years; we averaged 12 per month for the fourth quarter of 2024, compared to 14 per month two years ago and 11 per month a year ago. Listings have averaged about the same over the last year. For the fourth quarter of 2024, we had 28. But they are down 12 from 2 years ago. Days On Market has gone up from a year ago. We hit 24, an increase of 39% in the fourth quarter of 2024 compared to 17 1 year ago, but we had 32 2 years ago.
Price Trends
The 2024 fourth quarter monthly average price of $813,000 is $3,000(-1%) lower than the 2024 third quarter monthly average price of $913,000. Compared to the 2023 fourth quarter monthly average price of $877,000, we had an increase of $4,000 (1%); compared to the 2022 fourth quarter monthly average of $770,000, we had an increase of $43,000 (6%).

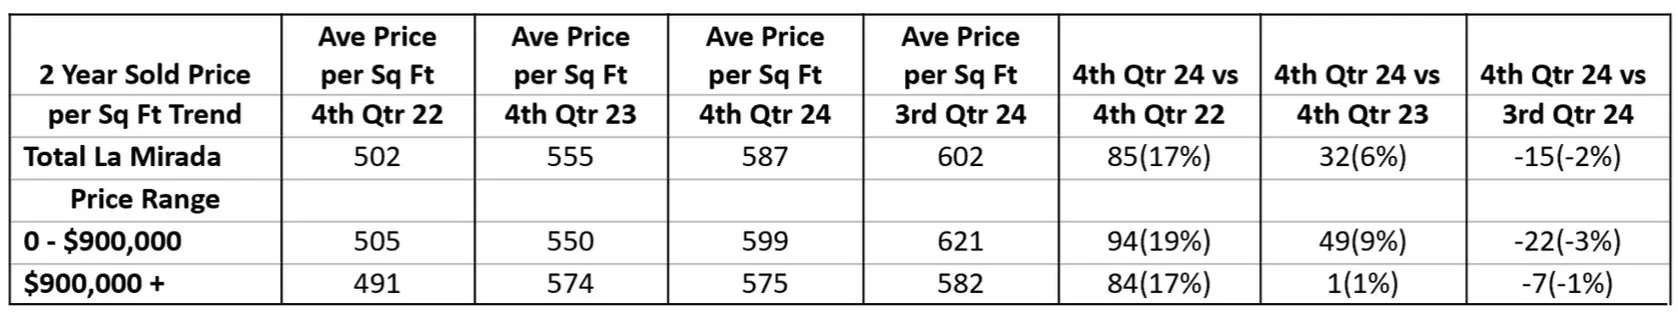
Price Per Square Foot
The 2024 fourth-quarter monthly average of $599 is $22(-3%) lower than the 2024 third-quarter monthly average of $621. Compared to the 2023 fourth-quarter monthly average of $550, we had an increase of $49 (9%); compared to the 2022 fourth-quarter monthly average of $505, we had an increase of $94 (19%).
Sales vs Active Listings (supply and demand)
When comparing sales and listings for the fourth quarter of 2024 to the third quarter of 2024, we had a monthly average of 12 sales in the fourth quarter of 2024, down 1(-12%) compared to a monthly average of 13 in the third quarter of 2024. When comparing listings, we had a monthly average of 28 in the fourth quarter of 2024, up 2(10%) compared to a monthly average of 26 in the third quarter of 2024.
When comparing sales and listings for the fourth quarter of 2024 to the fourth quarter of 2023, we had a monthly average of 12 sales in the fourth quarter of 2024, up 1(9%) compared to a monthly average of 11 in the fourth quarter of 2023. When comparing listings, we had a monthly average of 28 in the fourth quarter of 2024, up 6(31%) compared to a monthly average of 22 in the fourth quarter of 2023.
When comparing sales and listings for the fourth quarter of 2024 to the fourth quarter of 2022, we had a monthly average of 12 sales in the fourth quarter of 2024, down 2(-12%) compared to a monthly average of 14 in the fourth quarter of 2022. When comparing listings, we had a monthly average of 28 in the fourth quarter of 2024, down 12(-29%) compared to a monthly average of 40 in the fourth quarter of 2024.

Days on Market
The 2024 fourth quarter monthly average of Days On Market of 24 is 12(100%) higher than the 2024 third quarter monthly average Days On Market of 12. Compared to the 2023 fourth quarter monthly average of 17 we had an increase of 7(39%); compared to the 2022 fourth quarter monthly average of 32 we had a decrease of 8(-27%).
