

La Mirada Real Estate Market Trends For The City of La Mirada
City of La Mirada Six And Twelve-Month Comparison
Price Summary
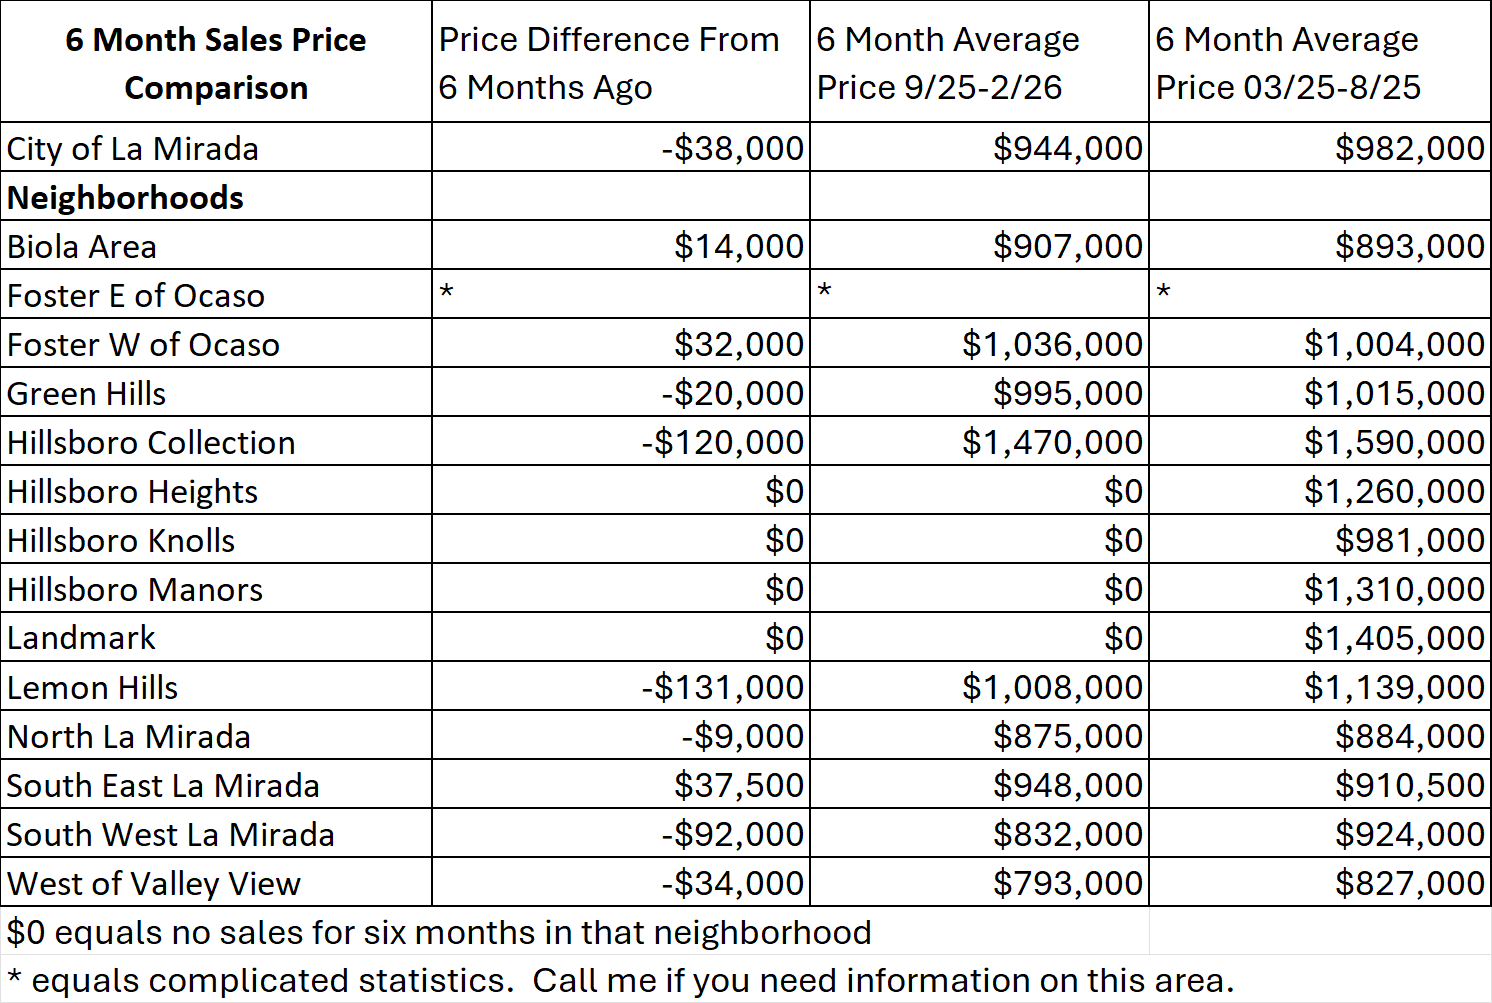
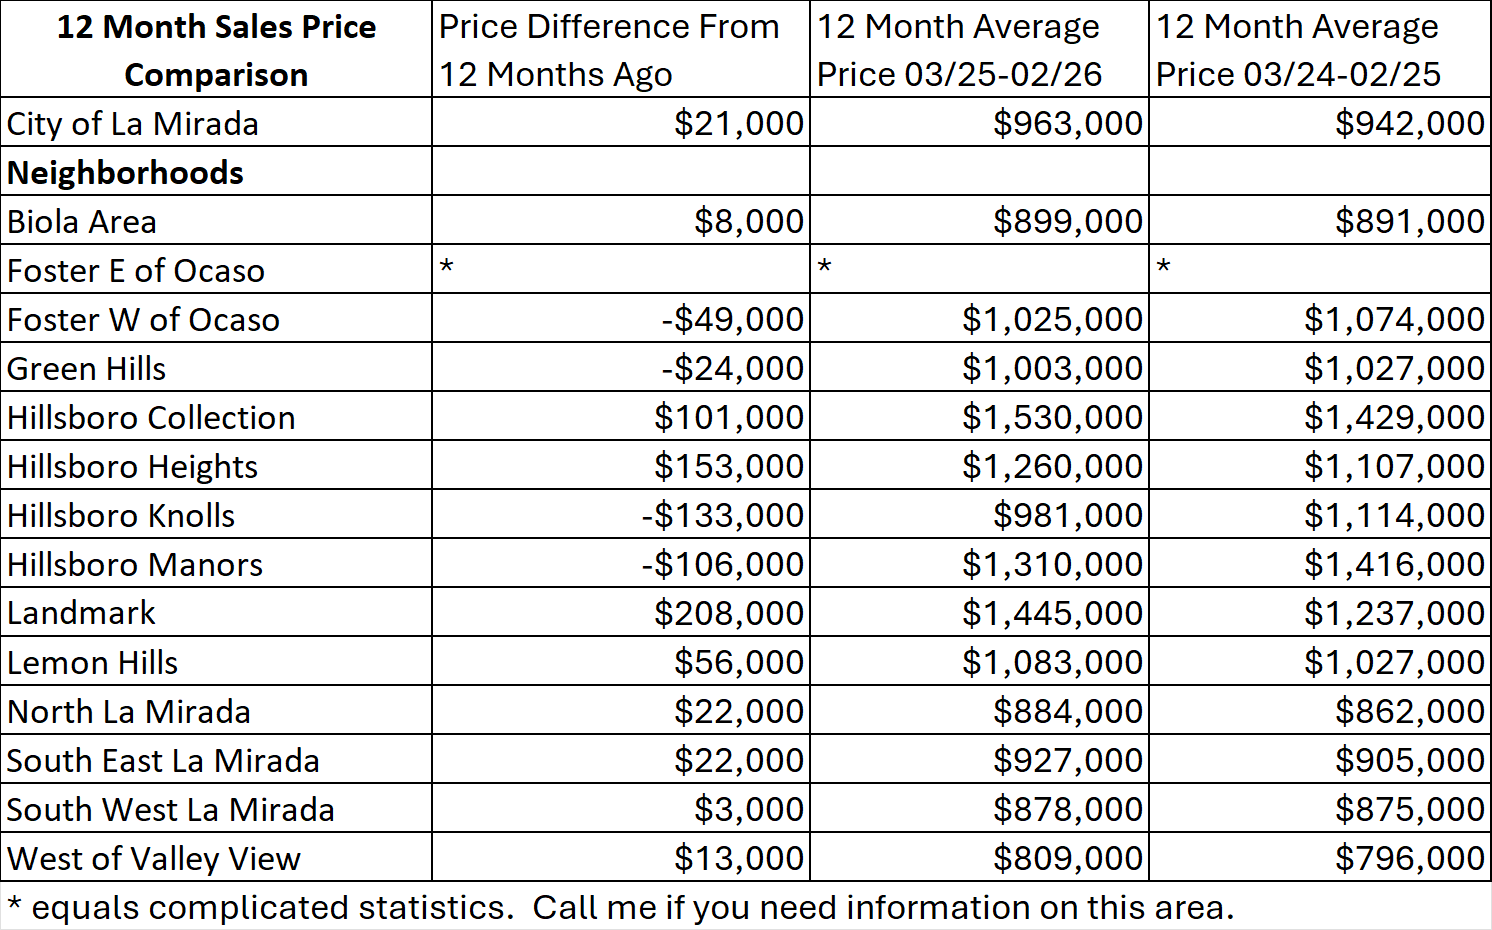
In the City of La Mirada, the average monthly price has decreased by $38,000 over the last 6 months. When we examine the last 12-month average, prices have increased by $21,000. Like most cities in the surrounding area, prices have started to go down.
City Forecast
The demand for the city has always been strong. La Mirada is a well-run city with diverse activities for all ages, offering a wide range of options. Examples would be the Theater. Golf course, Senior Center, Regional Park, local parks, Sports facilities for Soccer, Baseball, Softball, Basketball, and of course, swimming. Because the city is well-governed and offers substantial benefits to its residents, there is strong demand for it. This, combined with the low number of listings, increases the city's demand and helps keep prices up,
Prices in the area will continue to correct over the next few months, but should stabilize or possibly rebound by summer or towards the end of the year. With strong demand for the city and with a shortage of listings, barring any economic problems, the City of La Mirada will do well this year.
Price Statistics
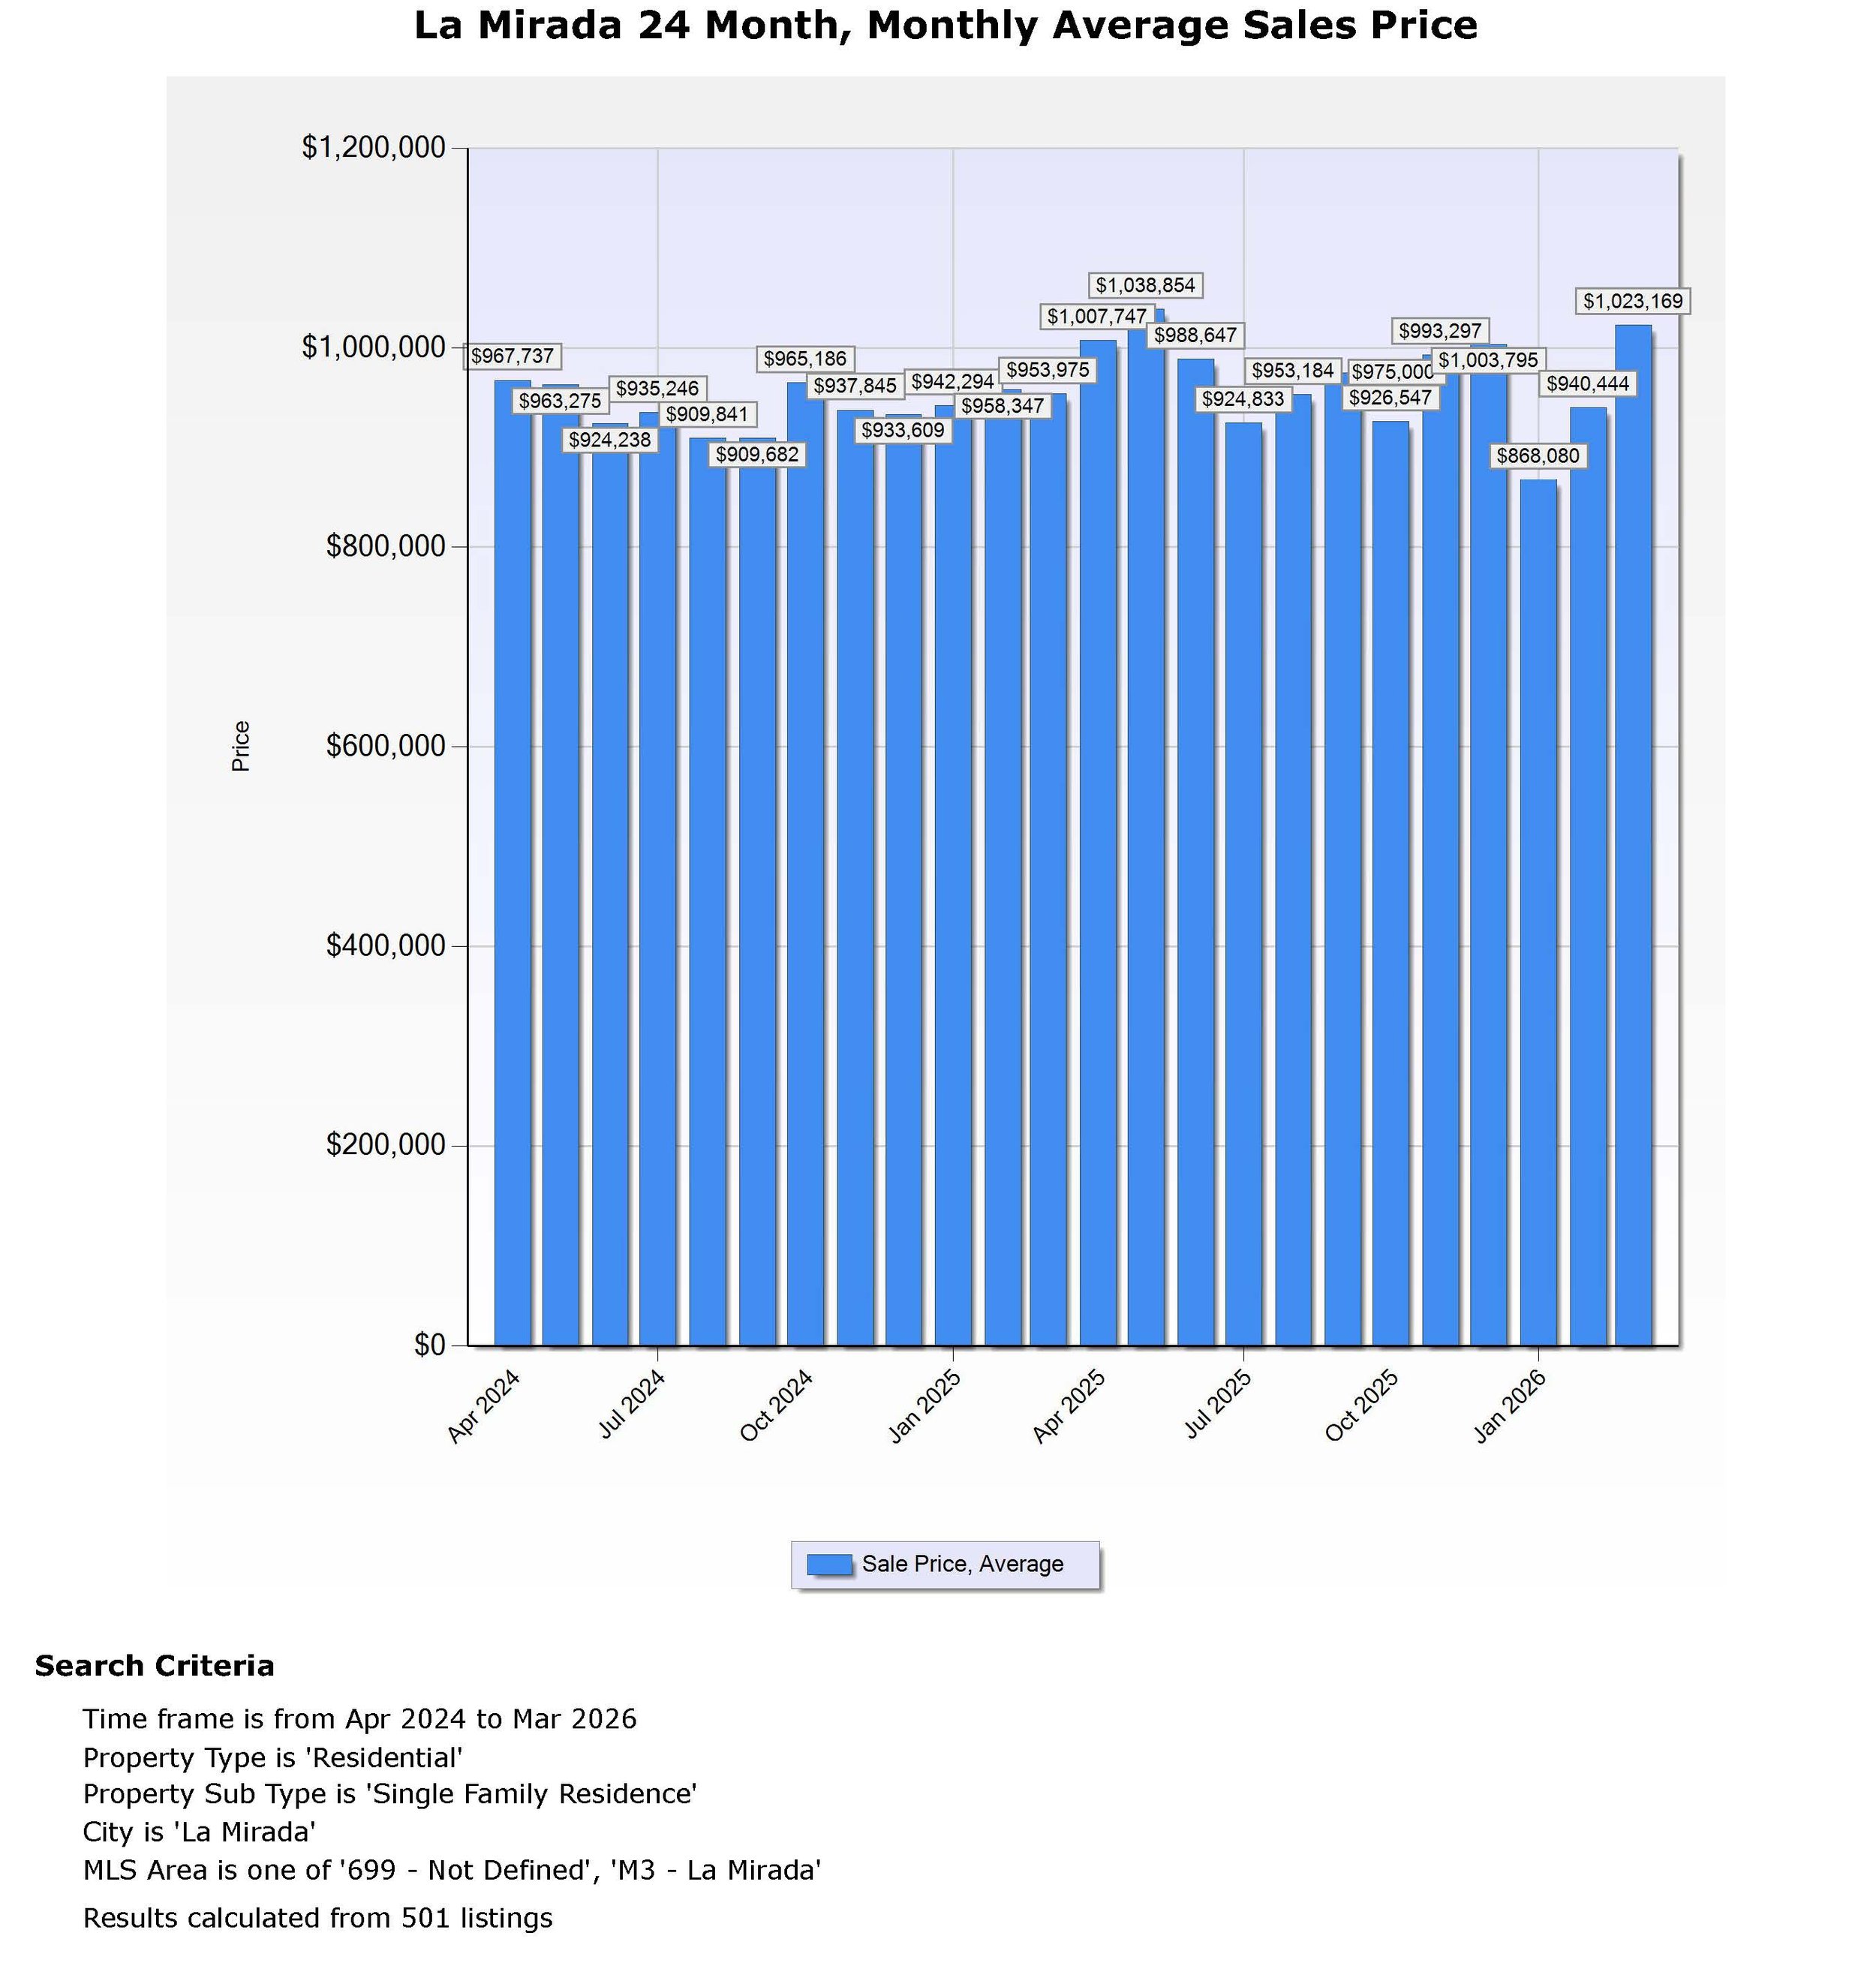
Over The Last six-months, the average monthly price for La Mirada was $944,000, compared to $982,000 for the six months before that. This results in an average monthly price decrease of $38,000 in La Mirada over the last six months. As you can see from the price graph, prices in La Mirada remained relatively stable over the last six months. The lowest monthly average for the last six months was $869,000, and the highest was $993,000. This yields a price spread of $124,000 for La Mirada over the last 6 months. The price difference will be due to factors such as property condition, added square footage, an added pool, and location.
Over The Last 12-months the average monthly price for La Mirada was $963,000, compared to $942,000 for the previous 12 months. This yields an average monthly price increase of $21,000 in the City of La Mirada over the last 12 months. As you can see from the price graph, prices in La Mirada have remained relatively stable over the last 12 months. The lowest monthly average for the last 12 months was $869,000, and the highest was $1,039,000. This yields a price spread of $170,000 for La Mirada over the previous 12 months. The price difference will be due to factors such as property condition, added square footage, an added pool, and location.
Thinking of Selling?
Start one of your biggest financial decisions with your best decision
Talk to Ty
Invest 30 minutes to put thousands of Dollars more in your pocket from the sale of your home.
All I ask is that you show me your home and let me spend 30 minutes explaining how we are different from any other company you will speak with—and how combining my resources with Firstteam that difference will get you the most value from your home sale.
I will make you 2 promises. 1 No sales talk, just a professional, informative conversation. 2 You won’t regret your decision.
With our current real estate market, now more than ever, the decision you make about who to list your property with will significantly impact the price you get for your home.
Ty Sutherland has over 40 years of experience.
Firstteam Real Estate #1 in Southern California for the last 15 years.
Call, text, or email me to start a no-obligation discussion about your home.
Cell 714 342-7270
Email tysutherland@firstteam.com
Sales Statistics
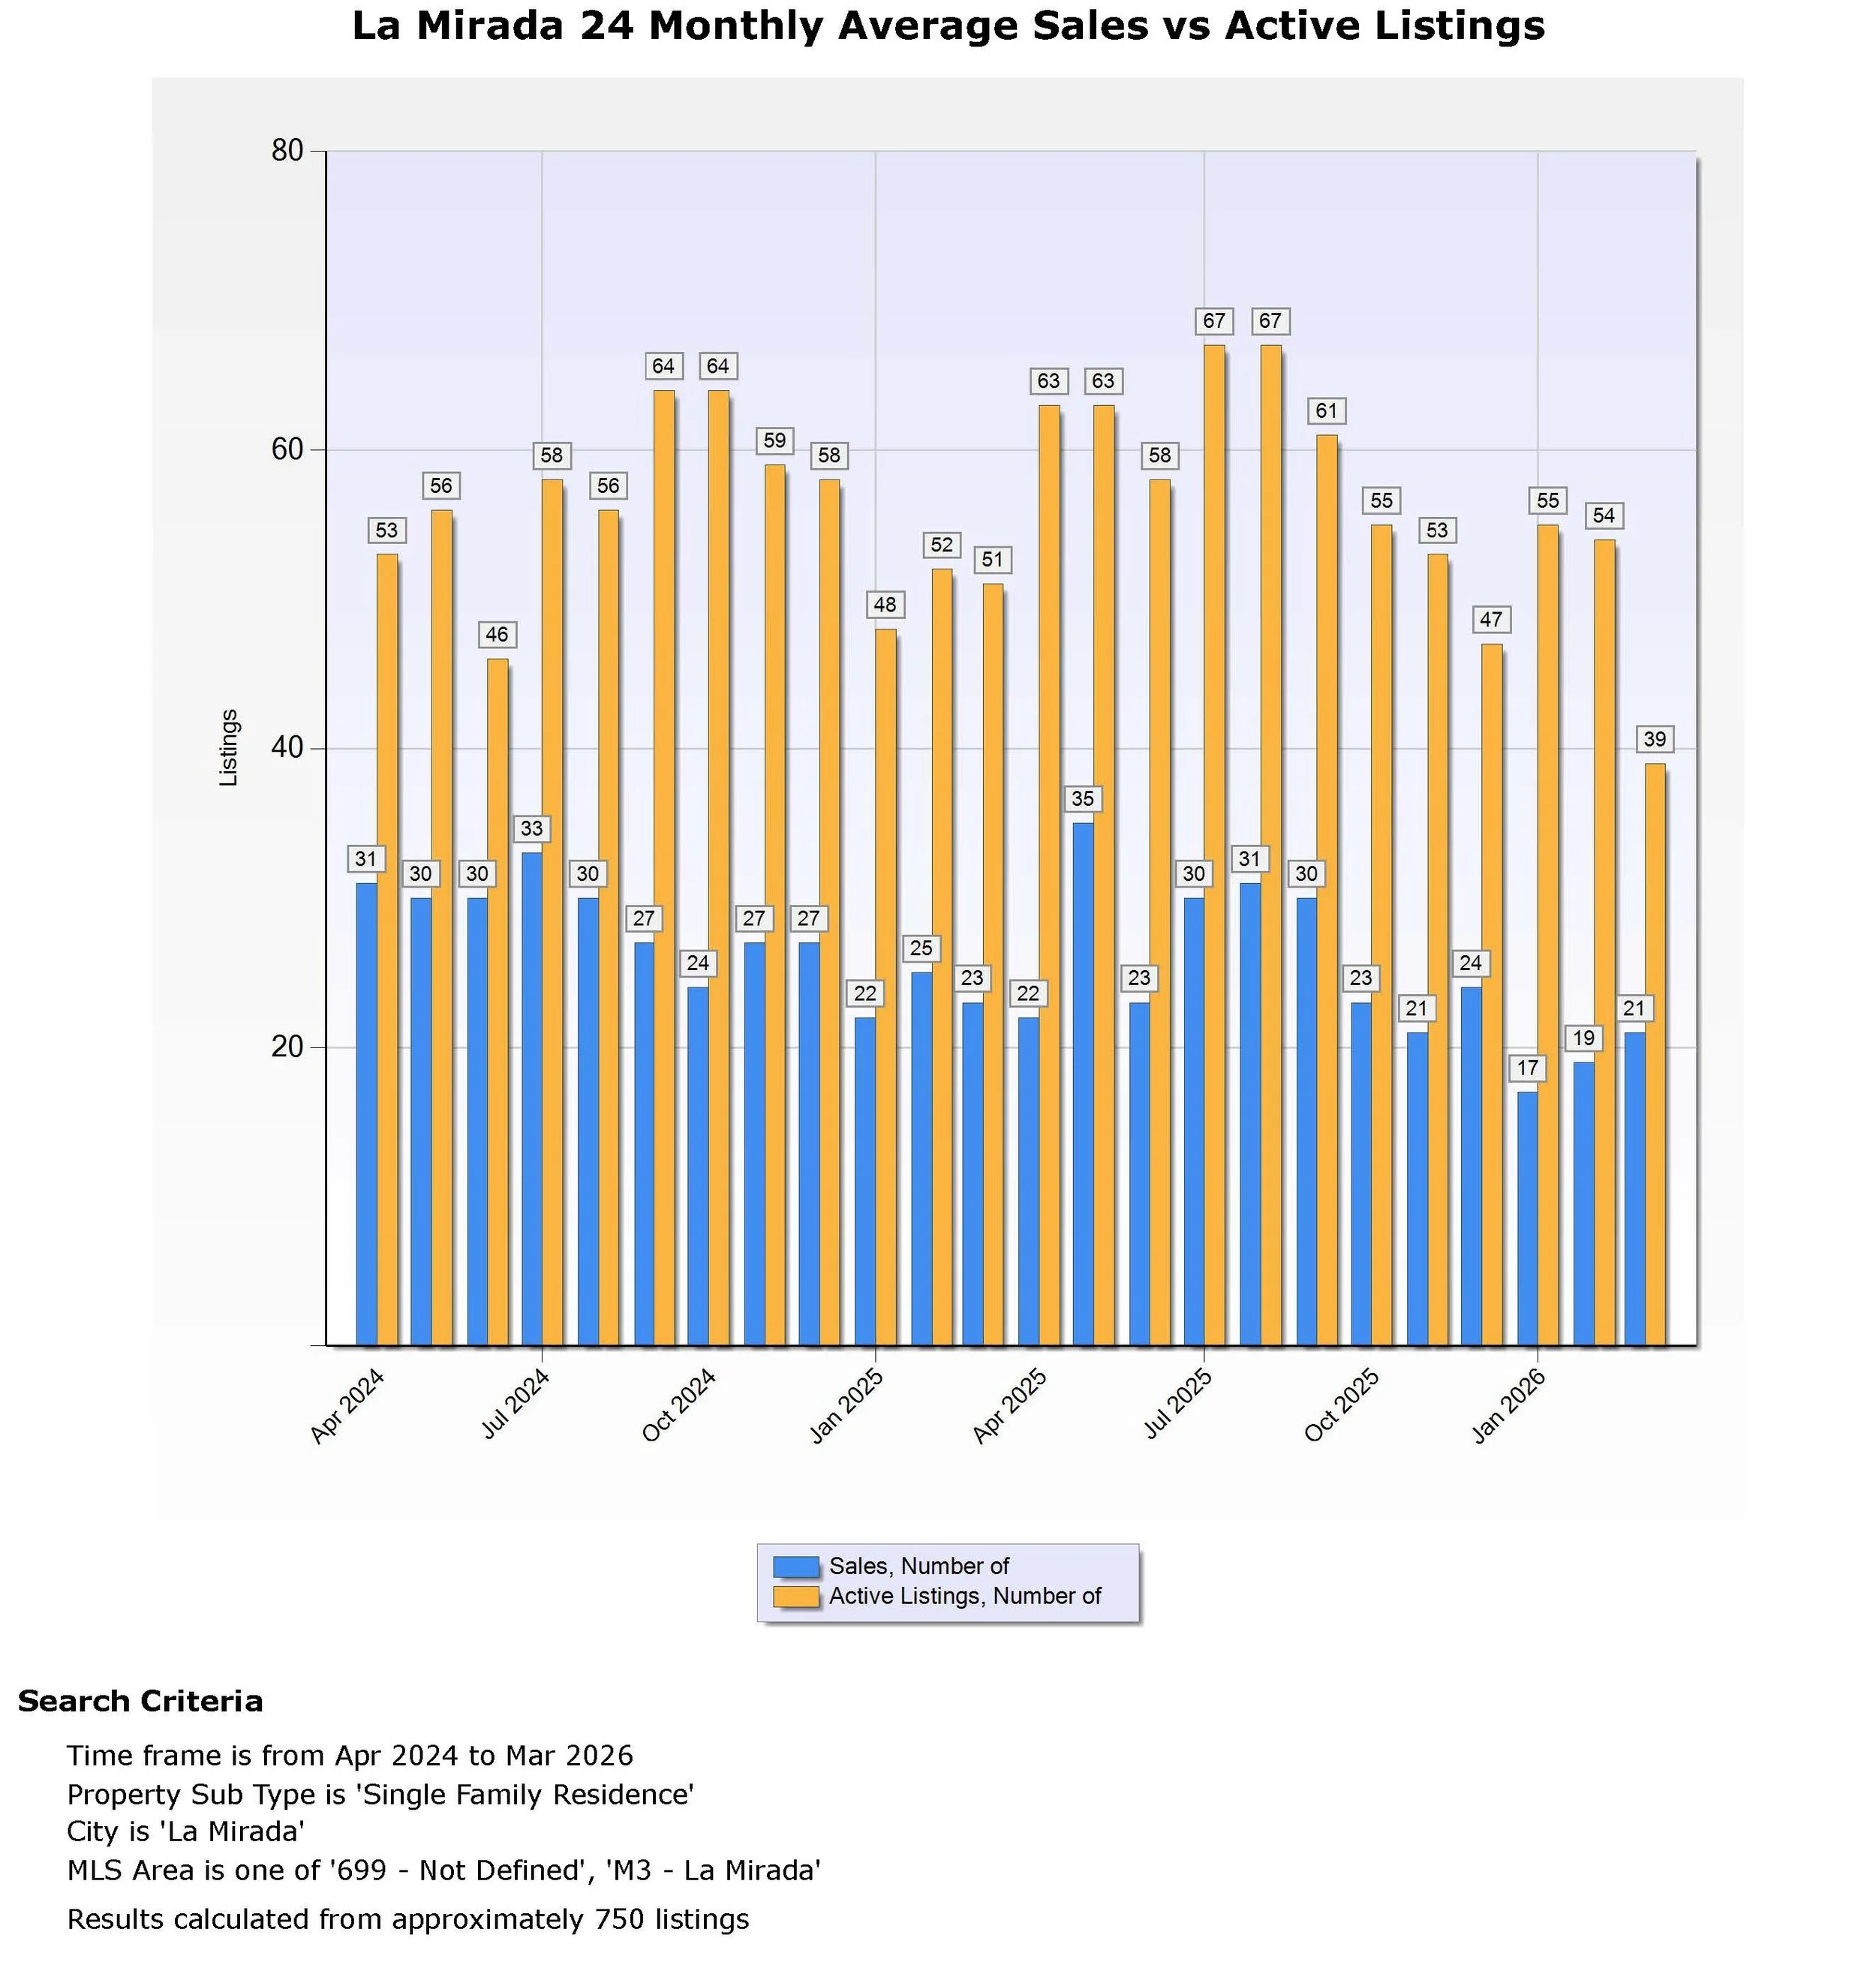
Over the last 6 months, we have observed average monthly decreases of 2.8 in sales and 4.0 in listings. This is based on the last 6-month average of 19.5 sales and 47.0 listings, compared to the previous 6 months, which averaged 22.3 sales and 51.0 listings.
In the last 6 months, homes in La Mirada have sold quickly, with an average of 30 days from listing to escrow.
Over the last 12 months, we have seen average monthly decreases of 1.1% in sales and a 4.7% increase in listings. This is based on the last 12-month average of 20.9 sales and 49.0 listings, compared to the previous 12 months, which averaged 22.0 sales and 44.3 listings.
Over the past 12 months, sales in La Mirada have averaged 25 days on the market before entering escrow.
City of La Mirada Twenty-Four-Month: Price Graph
City of La Mirada Twenty-Four-Month Demand Graph: Sales vs Listings
City of La Mirada compared to the Individual La Mirada neighborhoods.
All data is from the CRMLS