

Q1 Market Report - Lake Front Area
Lake Front Area Market Trends: $0-$800,000 Price Range
The following stats are for the Lake Front Area. I have divided the Total Big Bear Area into 10 Sub Areas to give you more detailed information on the area where your property is located. Like most of Big Bear, I have broken up the Lake Front Market into two segments. Up to $800,000 property value and the Luxury Market which is $800,000 and up. This seems to be the most accurate price range to split the market. Every three months, I will post detailed quarterly market trend tables and graphs for each price range with a condensed but easy to understand examination of the market stats. If you want to just get the short version of the market in the Lake Front area you can skip to the bottom of each price range and read the Summary.
Market Prices
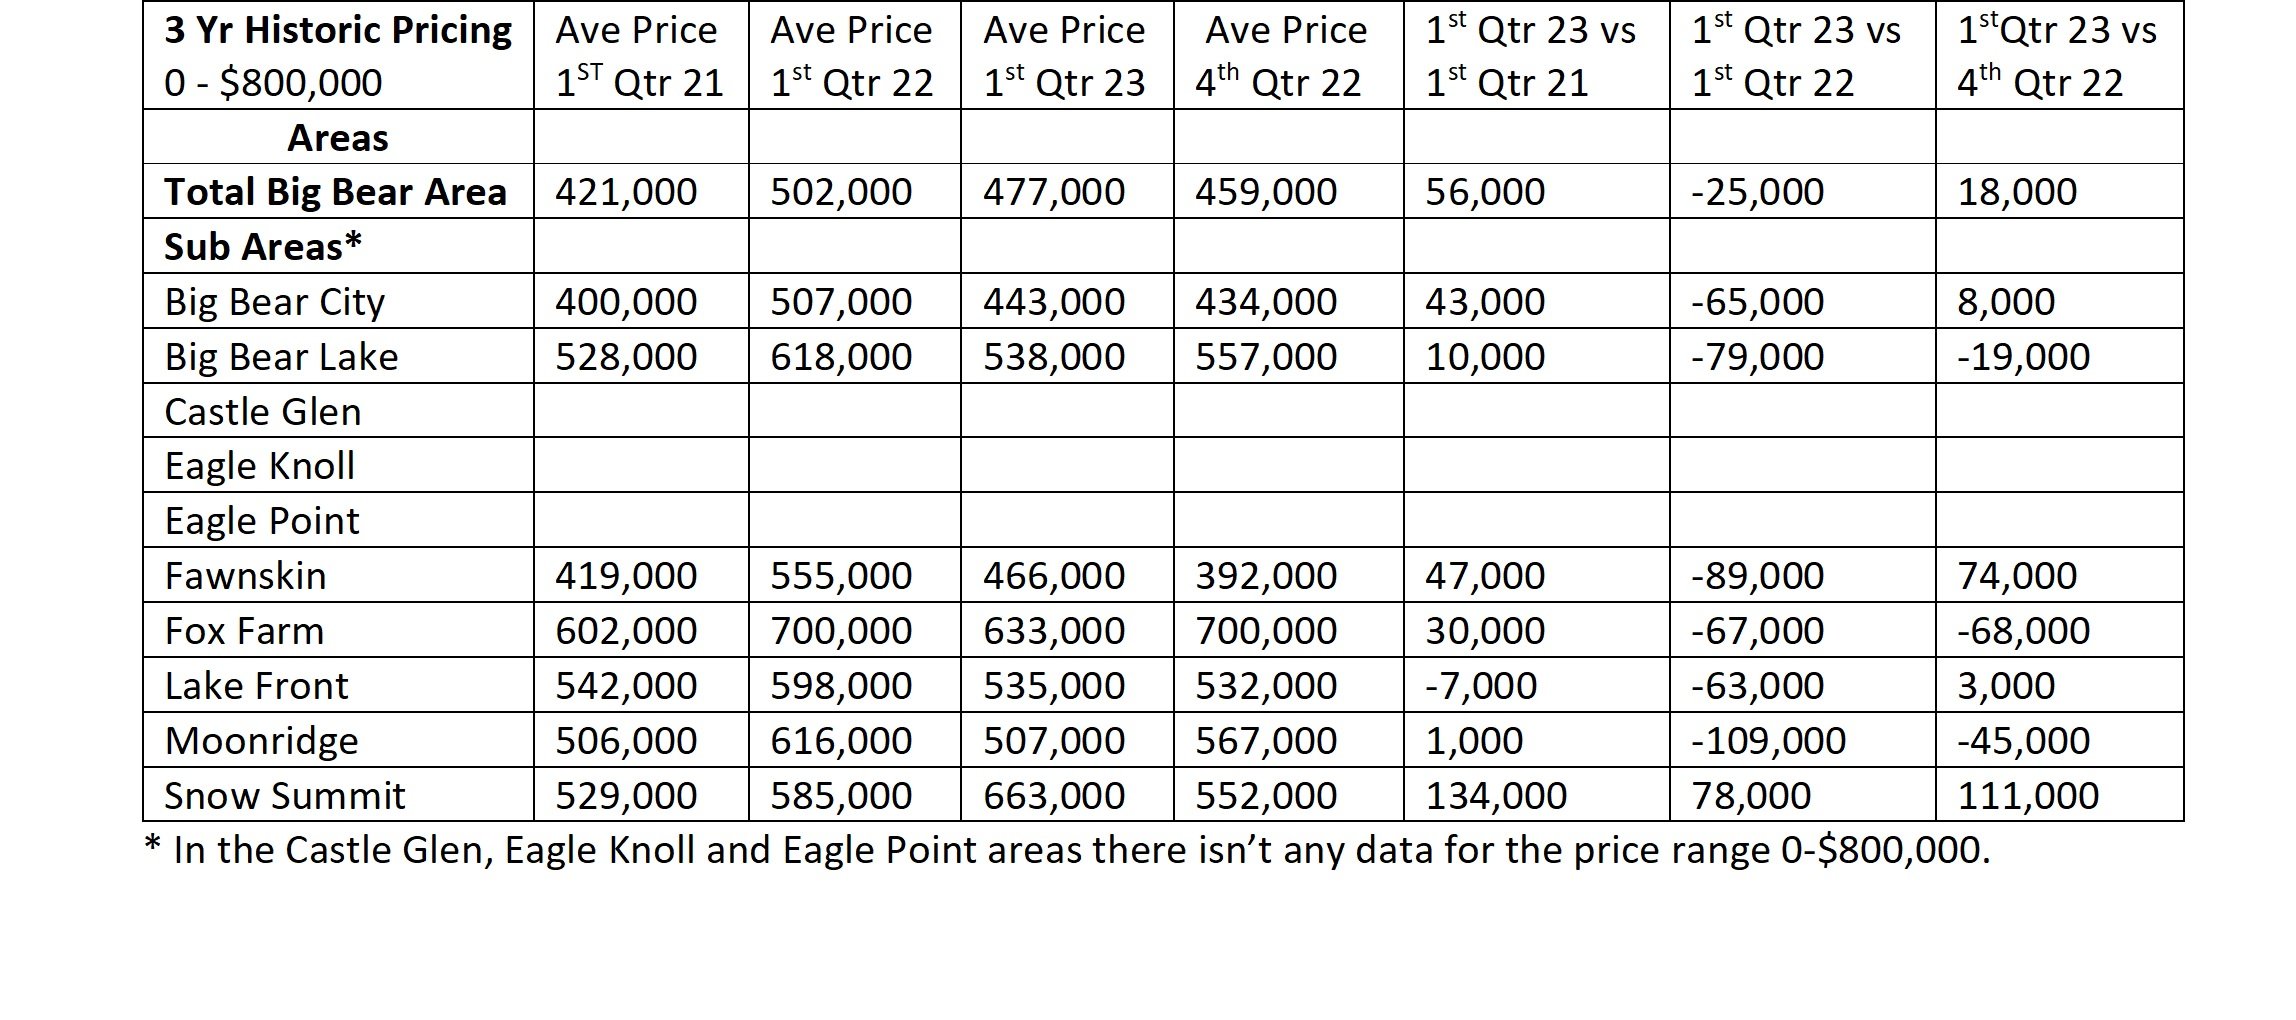
Tables 1 & 2 (below) were created from three-years of monthly average price graphs for the Total Big Bear Area and the 10 sub areas. Graph 1 below covers the Lake Front Area monthly stats. I will be using the tables to analyze what trends I see with Real Estate prices in the 0 - $800,000 Market in the Lake Front Area. The tables and graph have the parameters of: Price Range 0 - $800,000, from January 2021 to March of 2023.
In the Lake Front Area the first quarter of 2023 had an average monthly price of $535,000. This was down $7,000 from the 2021 first quarter average monthly price of $542,000. Not surprising the 2023 average monthly price for the first quarter was down $63,000 from the 2022 first quarter average monthly price of $598,000. But the 2023 first quarter average monthly price was up $3,000 from the 2022 fourth quarter average monthly price of $532,000.
The 2023 Lake Front Area first quarter average monthly price of $535,000 gives the Lake Front Area a ranking of 4 out of 10 of the sub areas for the Big Bear market. This price ranking puts the Lake Front Area in the top 40% of the Total Big Bear Area and beats the average monthly Total Big Bear Area price of $477,000 by $58,000.
To see how the prices in the other sub areas have done for comparison please refer to Table 2 below or check out the write up on that area.
If you want to know what your Big Bear cabin is worth in this price range in the Lake Front Area, contact me to get a more detailed market analysis that takes into consideration the number of Bedrooms, Bathrooms, Square Feet, Lot size, Condition and Views or location.


Sales vs Active Listings (supply and demand)
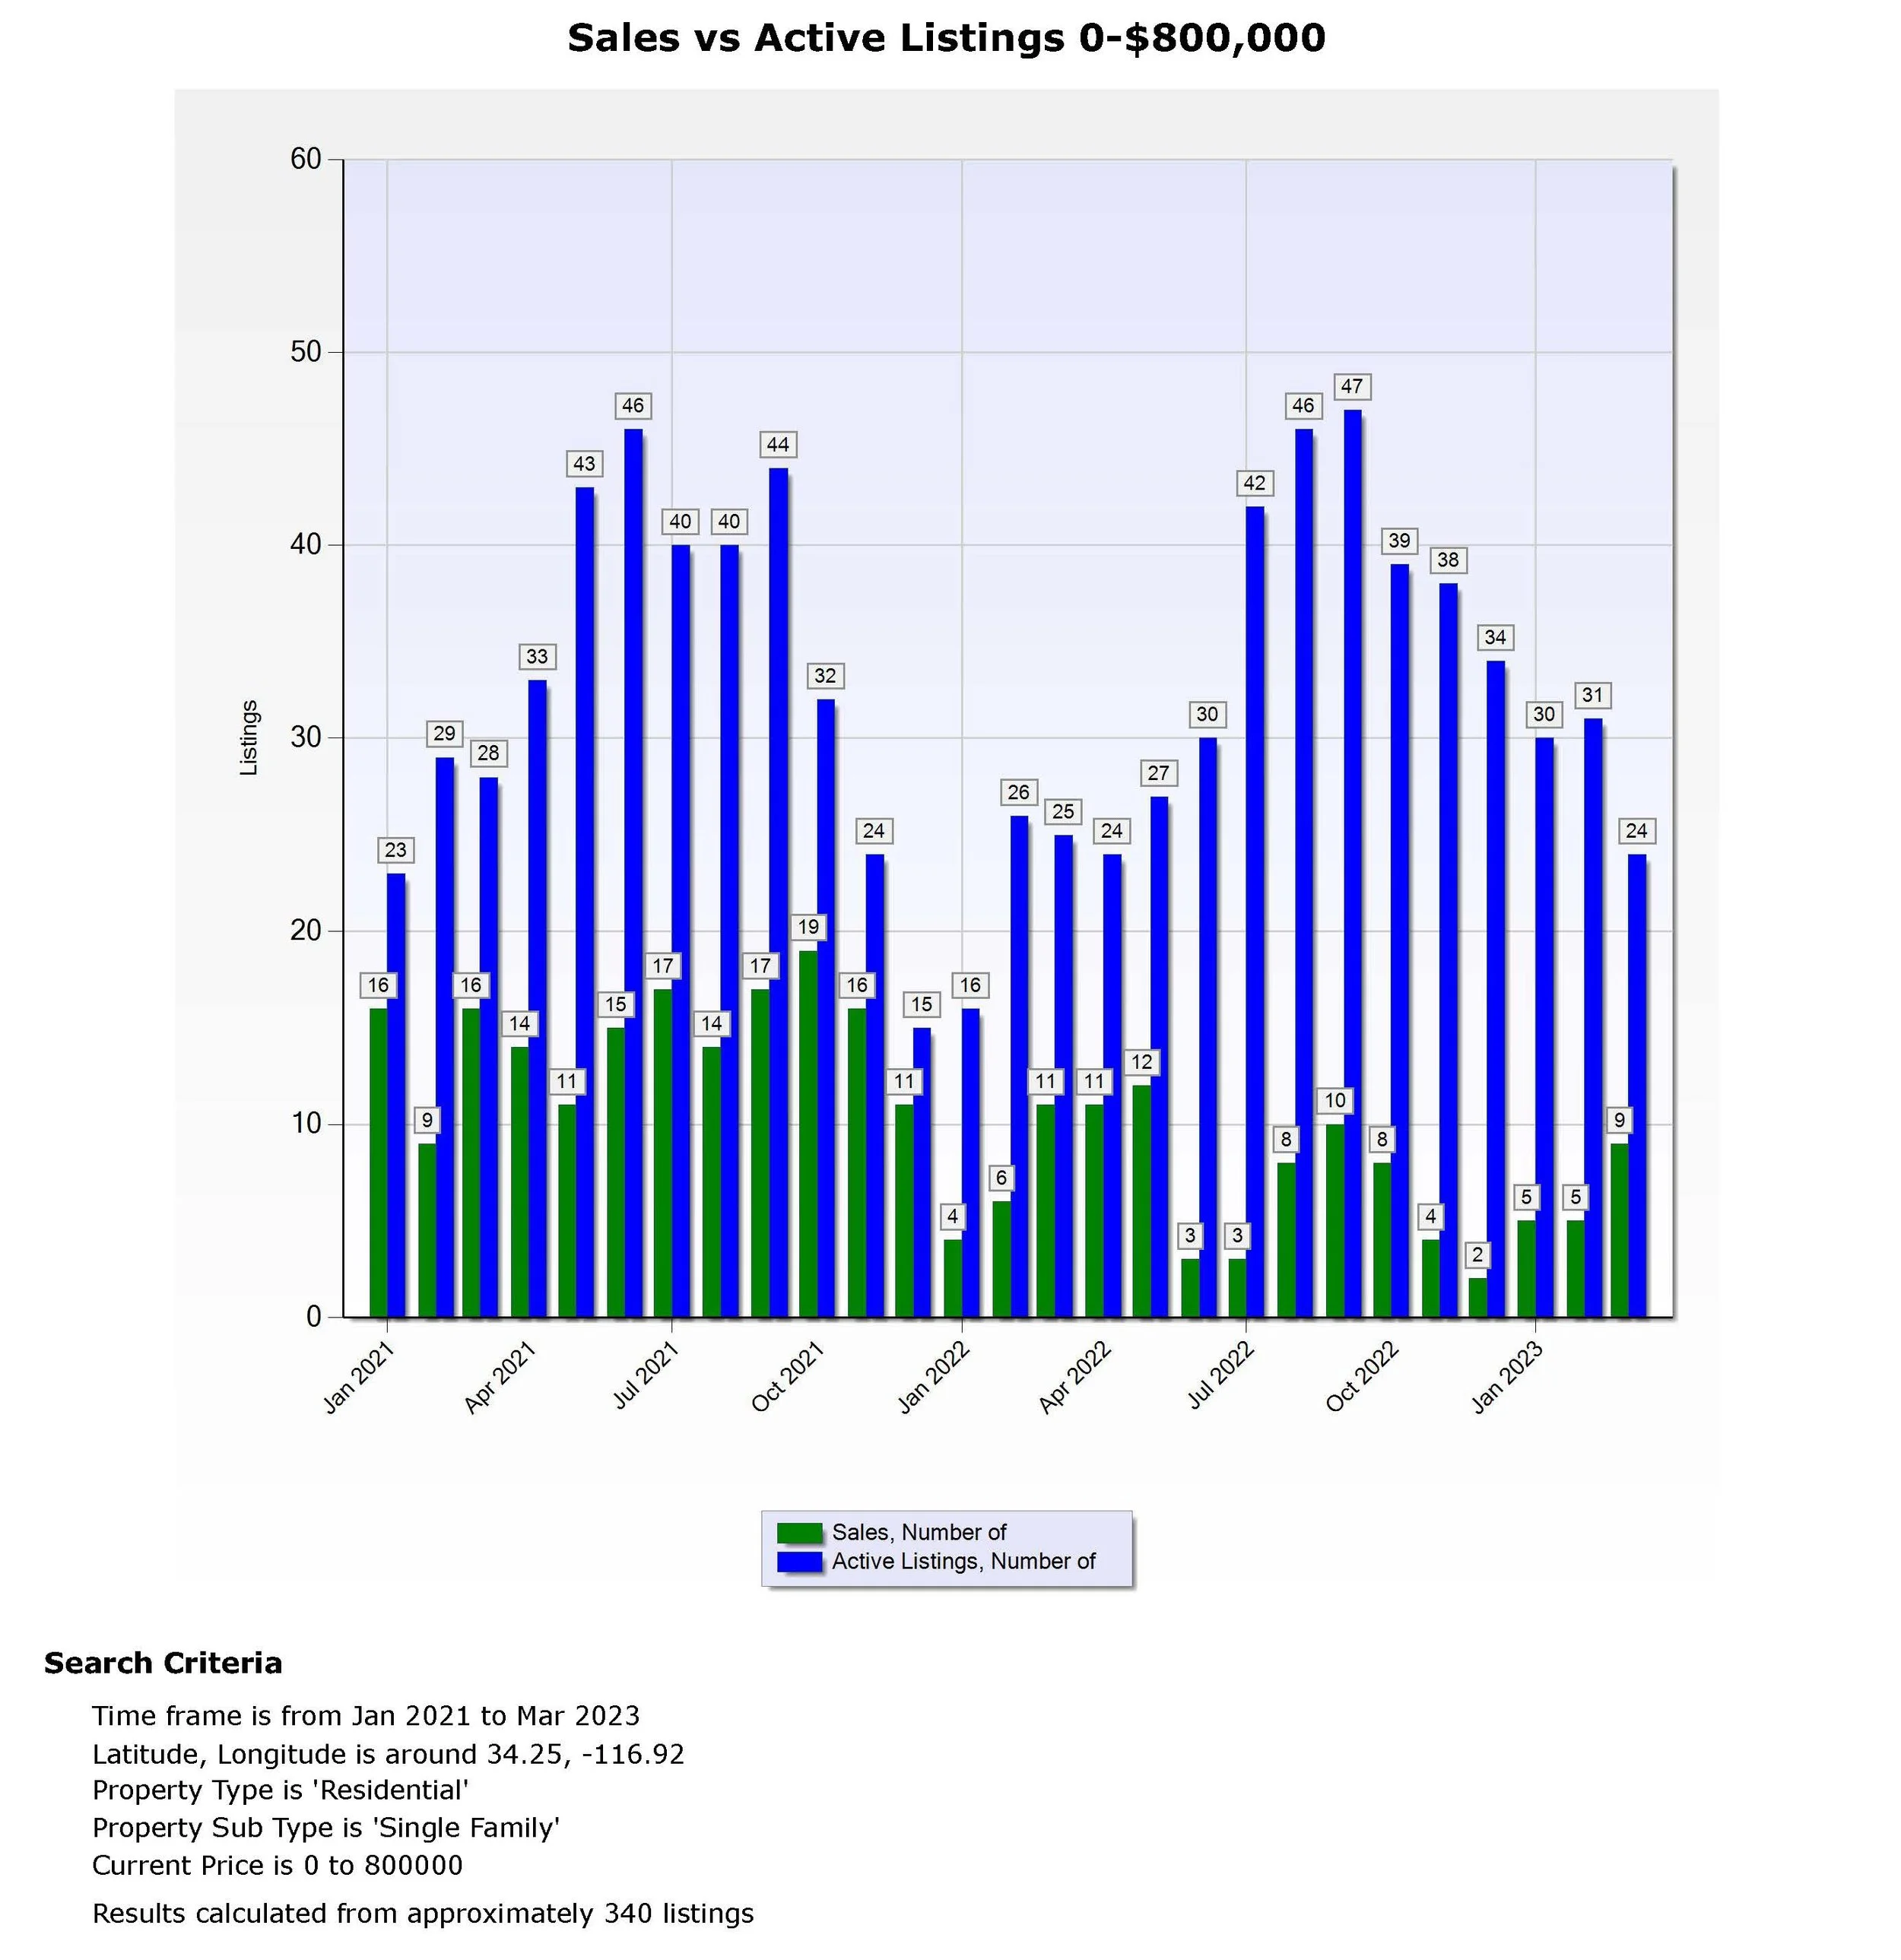
Table 3 shows what residential real estate inventory changes (Sales vs Active listings) have occurred for the Total Big Bear Area and sub areas. It is made up of monthly graphs for each area. Graph 2 below has the Lake Front Area monthly stats. These stats are compiled by using a parameter of: Price Range of 0 - $800,000 from the 3-year period January 2021 to March of 2023.
You can see from column 7 that, 2023 first quarter average monthly sales of 7 per month was 2 more than the average monthly sales of 5 per month for the fourth quarter of 2022. The average number of listings per month for the first quarter of 2023 was 28 which is 9 per month less when compared to the 37 average monthly listings for the fourth quarter of 2022.
When you look at column 6 you can see, 2023 first quarter average monthly sales of 7 per month was the same as the average monthly sales of 7 per month for the first quarter of 2022. The average number of listings per month for the first quarter of 2023 was 28 which is 4 per month less when compared to the 33 average monthly listings for the first quarter of 2022.
This shows us that the economic influences of higher rates and inflation have not affected sales in a negative way this quarter compared to last quarter and compared to a year ago. Given the current economic conditions I would expect the number of listings to go up and sales to decline or stay about the same. This will put pressure on prices to go down. Which is what you would expect in a declining market. So far, the Lake Front Area is experiencing a good market in sales.

Graph 3 In the Lake Front Area, the sales to expired ratios for the last two years have been at a good level with sales and expired listings between a 1:1 and a 1:2 ratio. There will always be expired listings. And a 1:1 ratio is considered a good ratio for a stable market. Now that we are staying in the 1:2 ratio like we have had for the last 5 months it is an indicator that this market has pressure to be in a stronger declining market.

Summary
Market Prices in the Lake Front Area in the first quarter of 2023 there was a decrease of $3,000 in average monthly price compared to the average monthly price for the fourth quarter of 2022. This was expected in a declining market. When you compare the Sales and Listings of the first quarter of 2023 to the fourth quarter of 2022. The Lake Front Area had a average monthly increase of 2 Sales per month the first quarter of 2023 even with a decrease of 9 Listings per month. As far as Expired Listings we have been experiencing a ratio of 1:2 the last 5 months vs a 1:1 ratio which is an indicator of a possible weaking of this market.
For vacation homes, the Lake Front Area is in a good market. It will be interesting to see what happens in the next few quarters.
Expect the possibility of the graphs for the next quarter and maybe the rest of 2023 to reflect a continued slow Real Estate Market. With the hope of keeping prices stabilized.
In my opinion when looking at the data of the overall market in Big Bear and the stats for the Lake Front Area we should have steady prices in the near future. The two big areas of market influence to watch is of course the economy and the amount of listings that come on the market. A worse economy and or a large increase of listings without an increase in sales will put a lot of pressure on prices to start to fall. This will also cause cabins to be on the market longer, which will put additional pressure on prices.
Lake Front Area Market Trends: $800,000 and Up Price Range
The following stats are for the Lake Front Area. I have divided the Total Big Bear Area into 10 Sub Areas to give you more detailed information where your property is located. Like most of Big Bear, I have broken up the Lake Front Market into two segments Up to $800,000 property value and the Luxury Market which is $800,000 and up. This seems to be the most accurate price range to split the market. Every three months, I will post detailed quarterly market trend tables and graphs for each price range with a condensed but easy to understand examination of the market stats.
Market Prices
In this price range there can be a difference of $400,000 or more in the monthly average price. You need to keep this in mind even with me taking the three-monthly stats to get a average quarterly monthly stat there can still be a short-term, large swing in prices.
Table 1 & 2 (below) were created from three-years of monthly average price graphs for the Total Big Bear Area and the 10 sub areas. Graph 1 below covers the Lake Front Area monthly stats. I will be using the tables to analyze what trends I see with Real Estate prices in the $800,000 and up Luxury Market in the Lake Front Area. The tables and graph have the parameters of: Price Range $800,000 and up, from January 2021 to March of 2023.
In the Lake Front Area the first quarter of 2023 had an average monthly price of $1,414,000. This was up $301,000 from the 2021 first quarter average monthly price of $1,113,000. Not surprising the 2023 average monthly price for the first quarter was down $4,000 from the 2022 first quarter average monthly price of $1,418,000. But the 2023 first quarter average monthly price was up $166,000 from the 2022 fourth quarter average monthly price of $1,248,000. Remember the possibility of wide market swings in this price range.
The 2023 Lake Front Area first quarter average monthly price of $1,414,000 gives the Lake Front Area a ranking of 2 out of 10 of the sub areas for the Big Bear Market. This price ranking puts the Lake Front Area in the top 20% of the Total Big Bear Area and beats the average monthly Total Big Bear Area price of $1,329,000 by $85,000.
To see how the prices in the other sub areas have done for comparison please refer to Table 2 below or check out the write up on that area.
If you want to know what your Big Bear cabin is worth in this price range in the Lake Front area, contact me to get a more detailed market analysis that takes into consideration the number of Bedrooms, Bathrooms, Square Feet, Lot size, Condition and Views or location.


Sales vs Active Listings (supply and demand)
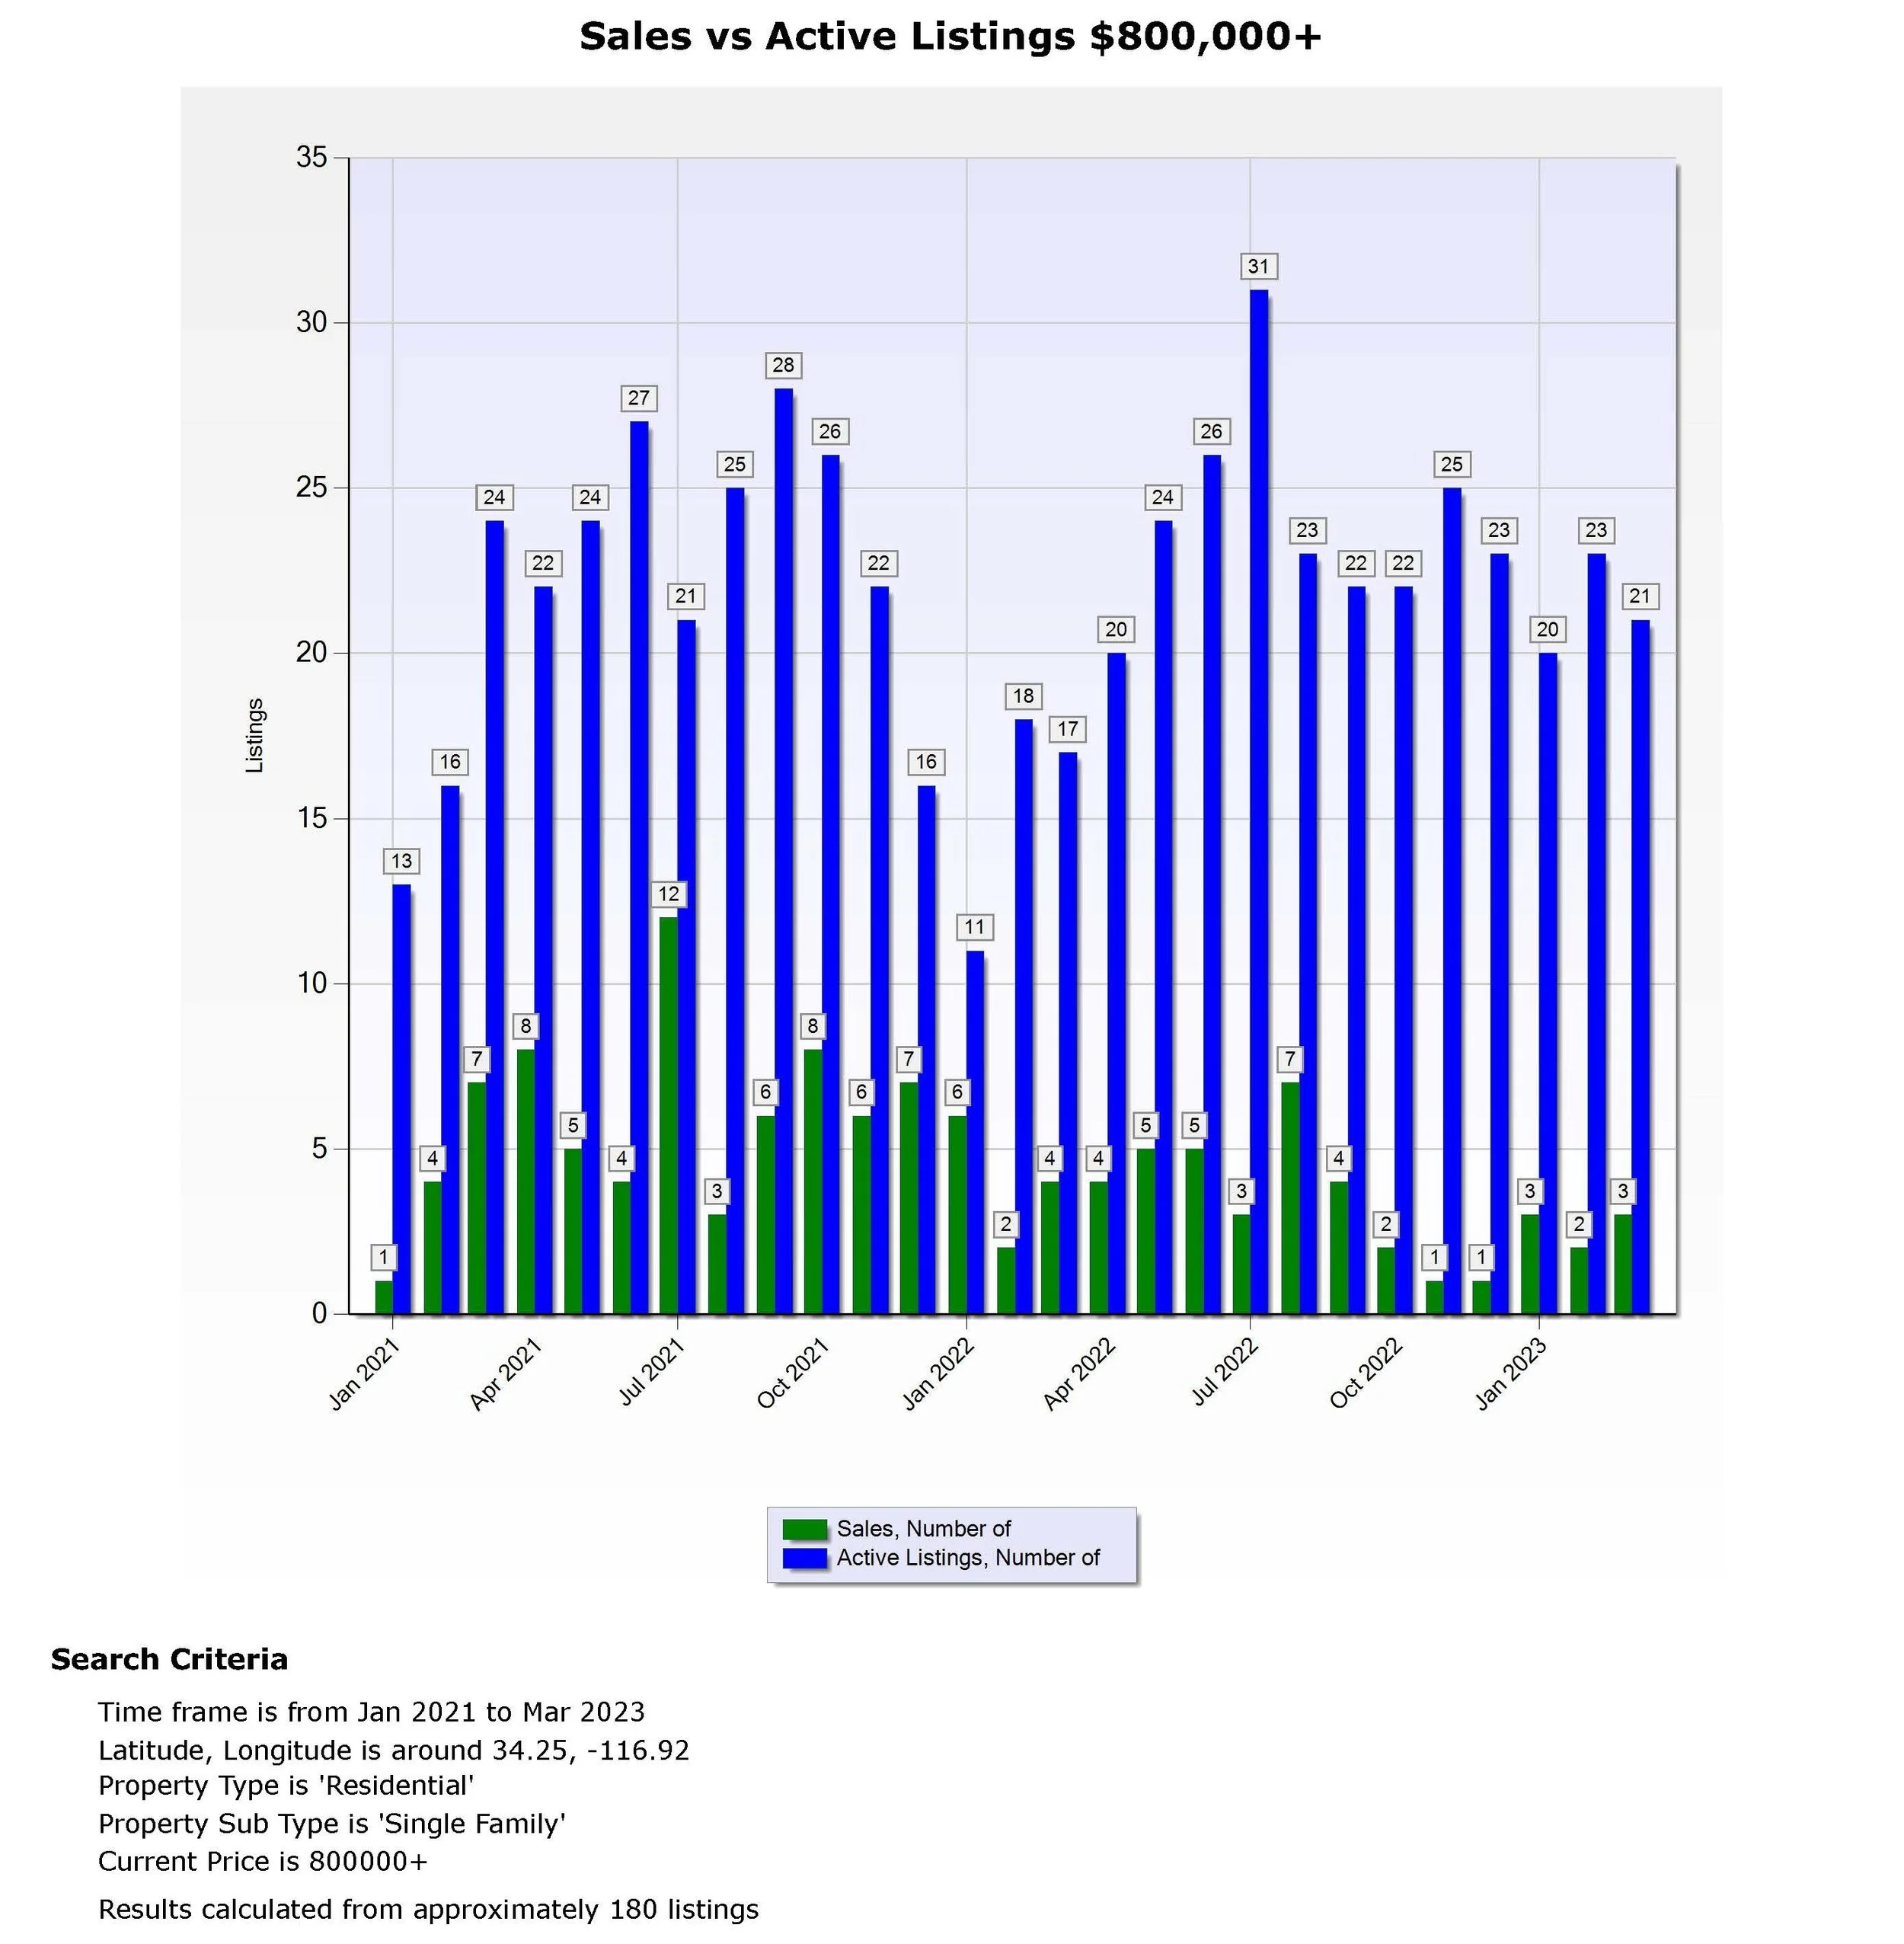
Table 3 shows what residential real estate inventory changes (Sales vs Active listings) have occurred for the Total Big Bear Area and sub areas. It is made up of monthly graphs for each area. Graph 2 below has the Lake Front Area monthly stats. These stats are compiled by using a parameter of: Price Range of $800,000 and up from the 3-year period January 2021 to March of 2023.
You can see from column 7 that, 2023 first quarter average monthly sales of 1 per month was 8 lower than the average monthly sales of 9 per month for the fourth quarter of 2022. The average number of listings per month for the first quarter of 2023 was 7 which is 2 per month less when compared to the 9 average monthly listings for the fourth quarter of 2022.
When you look at column 6 you can see, 2023 first quarter average monthly sales of 1 per month was 2 lower than the average monthly sales of 3 per month for the first quarter of 2022. The average number of listings per month for the first quarter of 2023 was 7 which is 4 per month more when compared to the 3 average monthly listings for the first quarter of 2022.
This shows us that the economic influences of higher rates and inflation have affected sales in a negative way this quarter compared to last quarter and compared to a year ago. Given the current economic conditions I would expect the number of listings to go up and sales to decline or stay about the same. This will put pressure on prices to go down. Which is what you would expect in a declining market. So far, the Moonridge Area is experiencing a declining market is sales.
It is also worth noting that during 2019 and before we were lucky to have 2 or 3 sales in three months in this price range for the whole Big Bear market. Where the first quarter of 2023 the Lake Front Area averaged 3 sales per month. So overall the Lake Front Area market is still in good condition concerning sales.

Graph 3 In the Lake Front Area, the sales to expired ratio for the last two years have been at a good level with sales and expired listings between a 1:1 and a 1:2 ratio. There will always be expired listings. And a 1:1 ratio is considered a good ratio for a stable market. Now that we are staying in the 1:2 ratio like we have had for the last 5 months it is an indicator that this market has pressure to be in a stronger declining market.

Summary
Market Prices in the Lake Front Area in the first quarter of 2023 there was a increase of $166,000 in average monthly price compared to the average monthly price for the fourth quarter of 2022. This was not expected in a declining market. But you have to remember to take into account the wide price swings in the Luxury Market. When you compare the Sales and Listings of the first quarter of 2023 to the fourth quarter of 2022. The Lake Front Area had a average monthly increase of 1 Sale per month the first quarter of 2023 even with a decrease of 2 Listings per month. As far as Expired Listings we have been experiencing a ratio of 1:2 the last 5 months vs a 1:1 ratio which is an indicator of a possible weaking of this market.
For vacation homes, the Lake Front Area is in a good market. It will be interesting to see what happens in the next few quarters.
Expect the possibility of the graphs for the next quarter and maybe the rest of 2023 to reflect a continued slow Real Estate Market. With the hope of keeping prices stabilized.
In my opinion when looking at the data of the overall luxury market in Big Bear and the stats for the Lake Front Area Luxury Market we should have steady prices in the near future. The two big areas of market influence to watch is of course the economy and the amount of listings that come on the market. A worse economy and or a large increase of listings without an increase in sales will put a lot of pressure on prices to start to fall. This will also cause cabins to be on the market longer, which will put additional pressure on prices.