

Q1 Market Report - Lake Front Area
The Lake Front Area is defined by the following boundaries: The lake shore, the Stanfield Cutoff, Big Bear Blvd and a line from Big Bear Blvd to the lake along Cove Dr.
Lake Front Area Market Trends
Every three months, I will post detailed quarterly market trend tables made from three year graphs, for the Total Big Bear Area and 10 Sub Areas. Using the tables and graphs I will report the trends of Market Prices, Sales vs Active Listings, and Expired Listings and summarize what they mean to the current and future Total Big Bear Area and 10 Sub Areas Real Estate Markets. This section is for the Lake Front Area. The following analysis is a detailed but easy to understand examination of these market trends.
The following stats have 2 sections. Section 1 up to $800,000 property value and Section 2 $800,000 and up, the Luxury Market. This seems to be the most accurate price range to split the market. If you want to just get the short version of the market in the Lake Front Area, you can skip to the bottom of Section 1 and Section 2 and read the Overall Summary.
Section 1 notes: the Castle Glen, Eagle Knolls and Eagle Point/Eagle Point Estates Areas are not included in section 1 stats due to the fact that there aren’t any sales under $800,000 in these areas.
Section 2 notes: the possibility of wide swings in monthly and quarterly market prices in the $800,000 and up Luxury Market.
Section 1 up to $800,000
Market Prices
Last Quarter Market Trends Surprisingly, the 2024 average monthly price for the first quarter of $531,333 was up $12,667 from the 2023 fourth quarter average monthly price of $518,667.
1 Year Market Trends The 2024 average monthly price for the first quarter of $531,333 was up $17,333 from the 2023 first quarter average monthly price of $514,000.
3 Year Market Trends The 2024 average monthly price for the first quarter of $531,333 was down $66,333 from the 2022 first quarter average monthly price of $597,667.
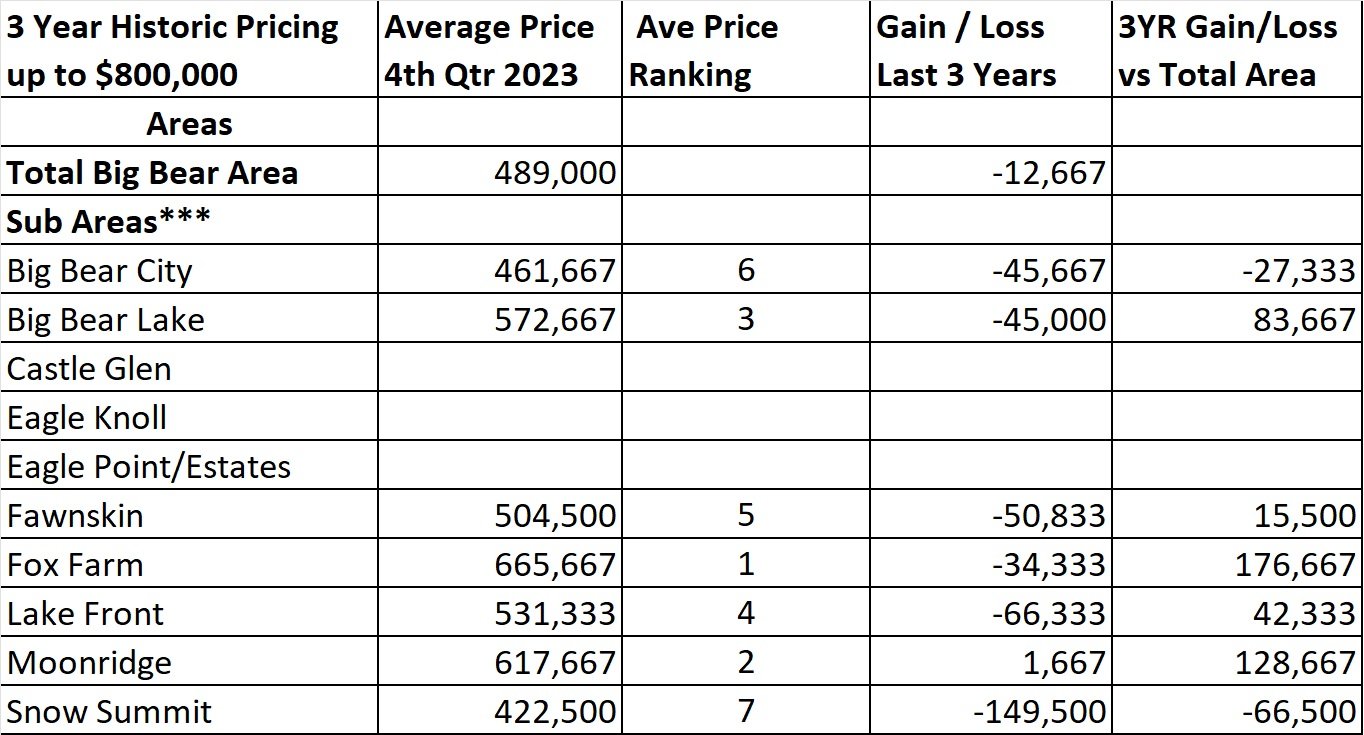
Area Ranking The 2024 first quarter average monthly price of $531,333 gives the Lake Front Area a ranking of 4th highest in price out of the 7 sub areas for this price range, for the Total Big Bear Market. We also see in this quarter the Lake Front Area has a $42,333 higher average monthly price compared to the Total Big Bear average monthly price of $489,000.
Total Big Bear Area $489,000
The sub areas ranked as follows:
Fox Farm $665,667
Moonridge Area $617,667
Big Bear Lake Area $572,667
Lake Front Area $531,333
Fawnskin Area $504,500
Big Bear City $461,667
Snow Summit Area $422,500
Price Summary These numbers shows us that compared to last quarter the economic influences of higher rates and inflation have not affected prices in a negative way with prices up $12,667. When compared to 1 year ago prices are up $17,333. And when compared to 3 years ago prices are down $66,333. Until we see a change from interest rates or an increase in buyers starting to buy in the current economic conditions I would expect the number of listings to go up and sales to decline or stay about the same. This might put pressure on prices to go down.
If you want to know what your Lake Front cabin is worth in this price range, contact me to get a more detailed market analysis that takes into consideration the number of Bedrooms, Bathrooms, Square Feet, Lot size, Condition, Views and location.


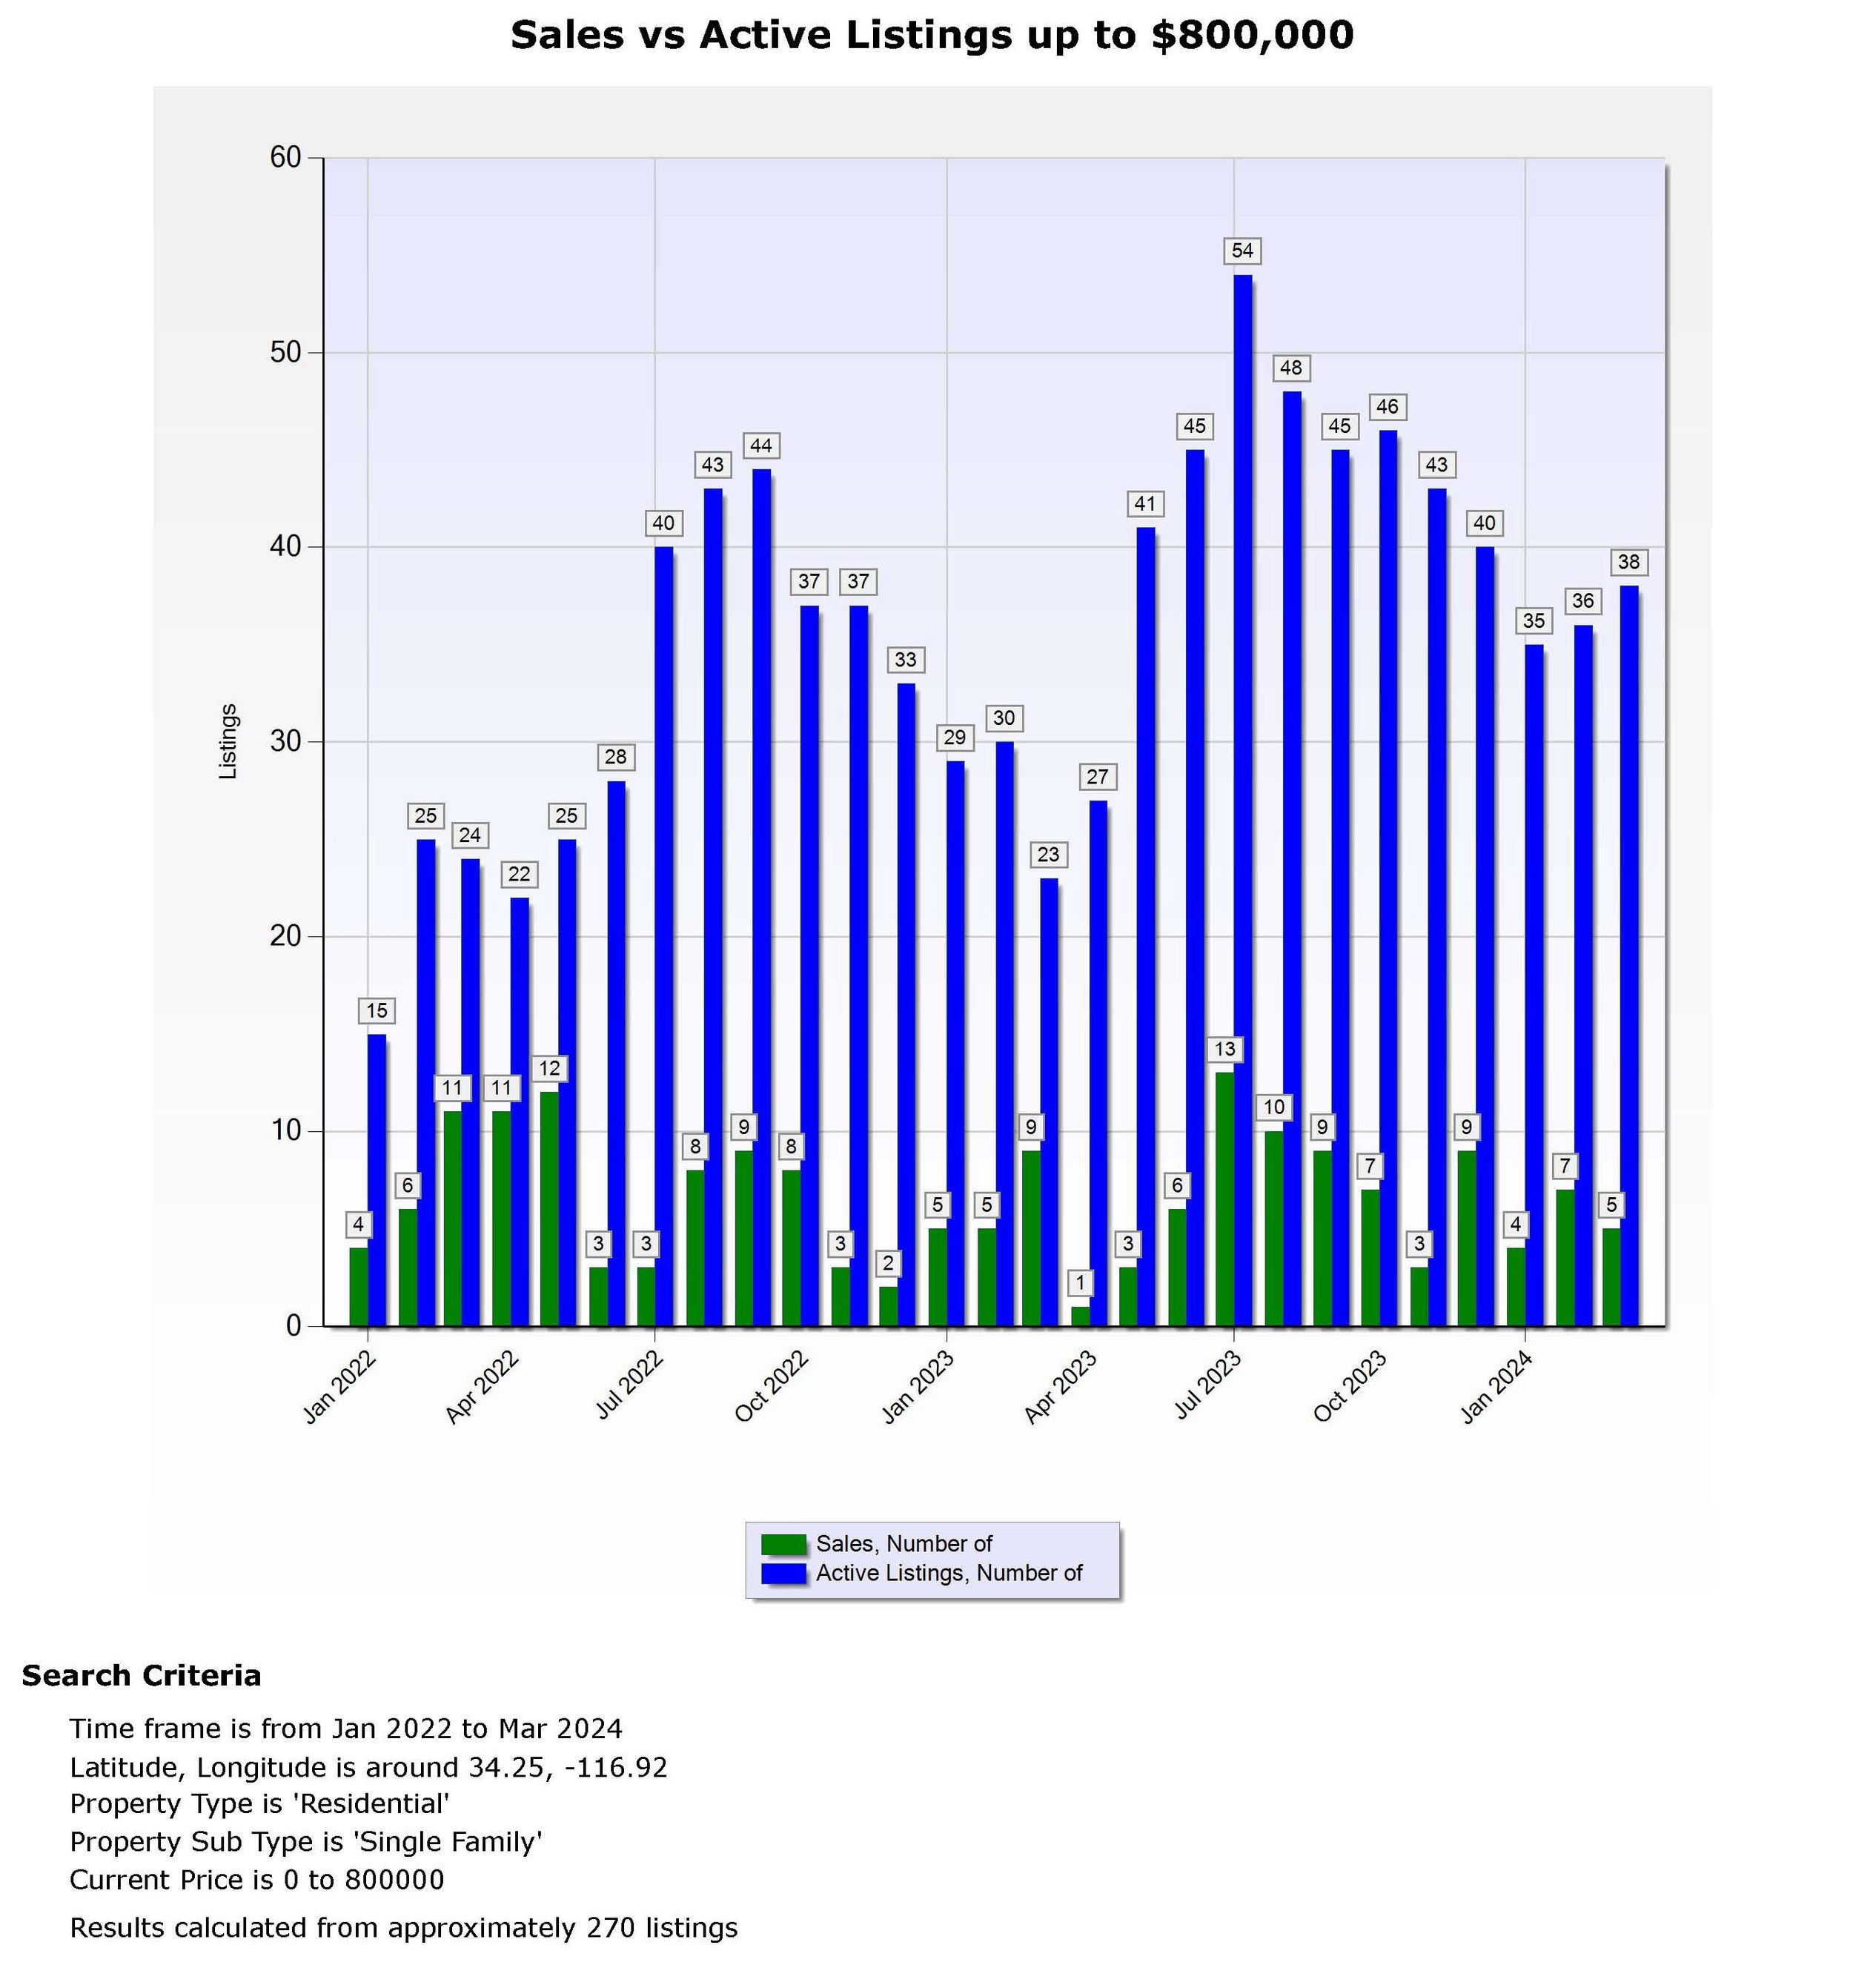
Sales vs Active Listings (supply and demand)
Last Quarter The first quarter of 2024 had average monthly sales of 5 per month. Which was a decrease of 1 sales per month when compared to the sales of 6 per month for the fourth quarter of 2023. The average number of listings per month for the first quarter of 2024 was 36 which is 7 per month less when compared to the 43 average monthly listings for the fourth quarter of 2023.
1 Year Average The first quarter of 2024 had average monthly sales of 5 per month. Which was a decrease of 1 sales per month when compared to the sales of 6 per month in the first quarter of 2023. The average number of listings per month for the first quarter of 2024 was 36 which is 9 per month more when compared to the 27 average number of listings for the first quarter of 2023.
3 Year Average The first quarter of 2024 had average monthly sales of 5 per month. Which was a decrease of 2 sales per month when compared to the sales of 7 per month in the first quarter of 2022. The average number of listings per month for the first quarter of 2024 was 36 which is 15 per month more when compared to the 21 average monthly listings for the first quarter of 2022.
Sales vs Active Listings Summary These numbers show us that compared to last quarter the economic influences of higher rates and inflation have affected sales and listings in a slightly negative way with sales down 2 and listings up 15. And when compared to to 1 year ago sales are down 1 and listings are up 9. And when compared to 3 years ago sales are down 1 and listings are down 7. Until we see a change from interest rates or an increase in buyers starting to buy in the current economic conditions I would expect the number of listings to go up, which they have and sales to decline or stay about the same. This could put pressure on prices to go down.

Sales vs Expired Listings (strength of sales)
Sales Vs Expired Market Trends Graph 3 In the Lake Front Area, the sales to expired ratios for the last two years have been at a good level with sales and expired listings at a 1:1 Ratio. Where a 1:1 ratio is considered a good ratio for a stable market. Now that we are staying in the 1:2 ratio like we have had for the last 3 out of 5 months it is an indicator that this market has pressure to be in a declining market.

up to $800,000 Overall Summary
Market Prices in the first quarter of 2024 there was an decrease in Price of $66,333 in average monthly price compared to the average monthly price for the fourth quarter of 2023. There was a increase in price of $17,333 from 1 year ago and a increase in price of $12,667 from 3 years ago.
Sales and Listings in the first quarter of 2024 there was a average monthly decrease in sales 1 per month and a decrease of 7 listings per month, compared to the fourth quarter of 2023. There was also a decrease of 1 Sales per month and a increase of 9 listings compared to 1 year ago. We also had a decrease of 2 sales per month and a increase of 15 listings per month compared to 3 years ago.
Expired Listings have been experiencing a ratio of 1:2 in the last 3 out of 5 months vs a 1:1 ratio which is an indicator of a possible weaking of this market.
These numbers show us that the economic influences of higher rates and inflation have affected prices, sales and listings in a negative way for the quarter. Prices have gone down significantly the last quarter but even with that decline we are slightly higher than 3 years go when prices were at their peak. But sales are down and listings are up, which is one factor why the last quarter had lower prices. So overall the Lake Front Area is doing well in this price range.
When looking at the data of the Lake Front Area the two big areas of market influence to watch are of course the economy and the number of listings that come on the market. A worse economy and or a large increase of listings without an increase in sales might put a lot of pressure on prices to fall even more. This will also cause cabins to be on the market longer, which will put additional pressure on prices. Until we see a change from interest rates or an increase in buyers starting to buy in the current economic conditions I would expect the number of listings to go up and sales to decline or stay about the same.
Section 2 $800,000 and up (Luxury Market)
Market Prices
Last Quarter Market Trends Surprisingly, the 2024 average monthly price for the first quarter of $1,087,333 was down $1,282,000 from the 2023 third quarter average monthly price of $2,369,333.
1 Year Market Trends The 2024 average monthly price for the first quarter of $1,087,333 was down $326,667 from the 2023 first quarter average monthly price of $1,414,000.
3 Year Market Trends The 2024 average monthly price for the first quarter of $1,087,333 was down $357,333 from the 2022 first quarter average monthly price of $1,444,667.
Area Ranking The 2024 first quarter average monthly price of $1,087,333 gives the Lake Front Area a ranking of 6th highest in price out of the 10 sub areas for this price range, for the Total Big Bear Market. We also see in this quarter the Lake Front Area has a $70,000 lower average monthly price compared to the Total Big Bear average monthly price of $1,157,333.
Total Big Bear Area $1,157,000
The sub areas ranked as follows:
Castle Glen Area $1,583,667
Snow Summit Area $1,200,000
Fox Farm Area $1,188,000
Big Bear Lake Area $1,109,000
Big Bear City $1,100,000
Lake Front Area $1,087,333
Moonridge $920,000
Eagle Point/Estates $875,000
Eagle Knoll $0
Fawnskin $0
Price Summary These numbers shows us that compared to last quarter the economic influences of higher rates and inflation or a wide price swing, have affected prices in a negative way with prices down $1,282,000. When compared to 1 year ago prices are down $326,667. And when compared to 3 years ago prices are down $357,333. But I think that this is an example of a wide price swing in this price range. Usually the Lake Front Area is among the leaders in price and would expect to see a swing with prices going up in the next few quarters. Until we see a change from interest rates or an increase in buyers starting to buy in the current economic conditions I would expect the number of listings to go up and sales to decline or stay about the same. This might put pressure on prices to go down.
Remember the possibility of wide swings in monthly and quarterly market prices in the $800,000 and up Luxury Market. See the first graph below “Historic Sales Price Trend $800,000+”.
If you want to know what your Lake Front cabin is worth in this price range, contact me to get a more detailed market analysis that takes into consideration the number of Bedrooms, Bathrooms, Square Feet, Lot size, Condition, Views and location.


Sales vs Active Listings (supply and demand)
Last Quarter The first quarter of 2024 had average monthly sales of 2 per month. Which is the same per month when compared to the sales of 2 per month for the fourth quarter of 2023. The average number of listings per month for the first quarter of 2024 was 20 which is 8 per month less when compared to the 28 average monthly listings for the fourth quarter of 2023.
1 Year Average The first quarter of 2024 had average monthly sales of 2 per month. Which was a decrease of 1 sales per month when compared to the sales of 3 per month in the first quarter of 2023. The average number of listings per month for the first quarter of 2024 was 20 which is the same per month when compared to the 20 average number of listings for the first quarter of 2023.
3 Year Average The first quarter of 2024 had average monthly sales of 2 per month. Which was a decrease of 2 sales per month when compared to the sales of 4 per month in the first quarter of 2022. The average number of listings per month for the first quarter of 2024 was 20 which is 5 per month more when compared to the 15 average monthly listings for the first quarter of 2022.
Sales vs Active Listings Summary These numbers show us that compared to last quarter the economic influences of higher rates and inflation have affected sales and listings in a negative way with sales the same and listings down by 8. And when compared to to 1 year ago sales are down 1 and listings are the same. And when compared to 3 years ago sales are down 2 and listings are up 5. Until we see a change from interest rates or an increase in buyers starting to buy in the current economic conditions I would expect the number of listings to go up and sales to decline or stay about the same. This could put pressure on prices to go down.
It is also worth noting that during 2019 and before we were lucky to have 2 or 3 sales in three months in this price range for the Total Big Bear Area market. Where in the first quarter of 2023 the Lake Front Area averaged 2 Sales per month.


Sales vs Expired Listings (strength of sales)
Sales Vs Expired Market Trends Graph 3 In the Lake Front Area, the sales to expired ratio for the last three years have been at a good level with sales and expired listings close to a 1:1 ratio. And a 1:1 ratio is considered a good ratio for a stable market. Now that we are staying in the 1:2 ratio like we have had for the last 5 out of 6 months it is an indicator that this market has pressure to be in declining market.

$800,000 and up Luxury Overall Summary
Market Prices in the first quarter of 2024 there was an decrease in Price of $1,282,000 in average monthly price compared to the average monthly price for the fourth quarter of 2023. This large amount was not expected. . There was also a decrease in price of $326,6675 from 1 year ago and a decrease in price of $357,333 from 3 years ago.
Sales and Listings in the first quarter of 2024 the average monthly sales were the same per month and a decrease of 8 listings per month, compared to the fourth quarter of 2023. There was also a decrease of 1 Sales per month and listings stayed the same compared to 1 year ago. We also had a decrease of 2 sales per month and a increase of 5 listings per month compared to 3 years ago.
Expired Listings have been experiencing a ratio of 1:2 in the last 5 out of 6 months vs a 1:1 ratio which is an indicator of a possible weaking of this market.
These numbers show us that the economic influences of higher rates and inflation and wide price swings have affected prices, sales and listings in a negative way. Usually the Lake Front Area is among the leaders in price and would expect to see a swing with prices going up in the next few quarters.
When looking at the data of the Lake Front Area the two big areas of market influence to watch are of course the economy and the number of listings that come on the market. A worse economy and or a large increase of listings without an increase in sales could put a lot of pressure on prices to fall even more. This will also cause cabins to be on the market longer, which will put additional pressure on prices. Until we see a change from interest rates or an increase in buyers starting to buy in the current economic conditions I would expect the number of listings to go up and sales to decline or stay about the same.