

Q2 Market Report - Lake Front
Lake Front Area Market Trends: $0-$800,000 Price Range
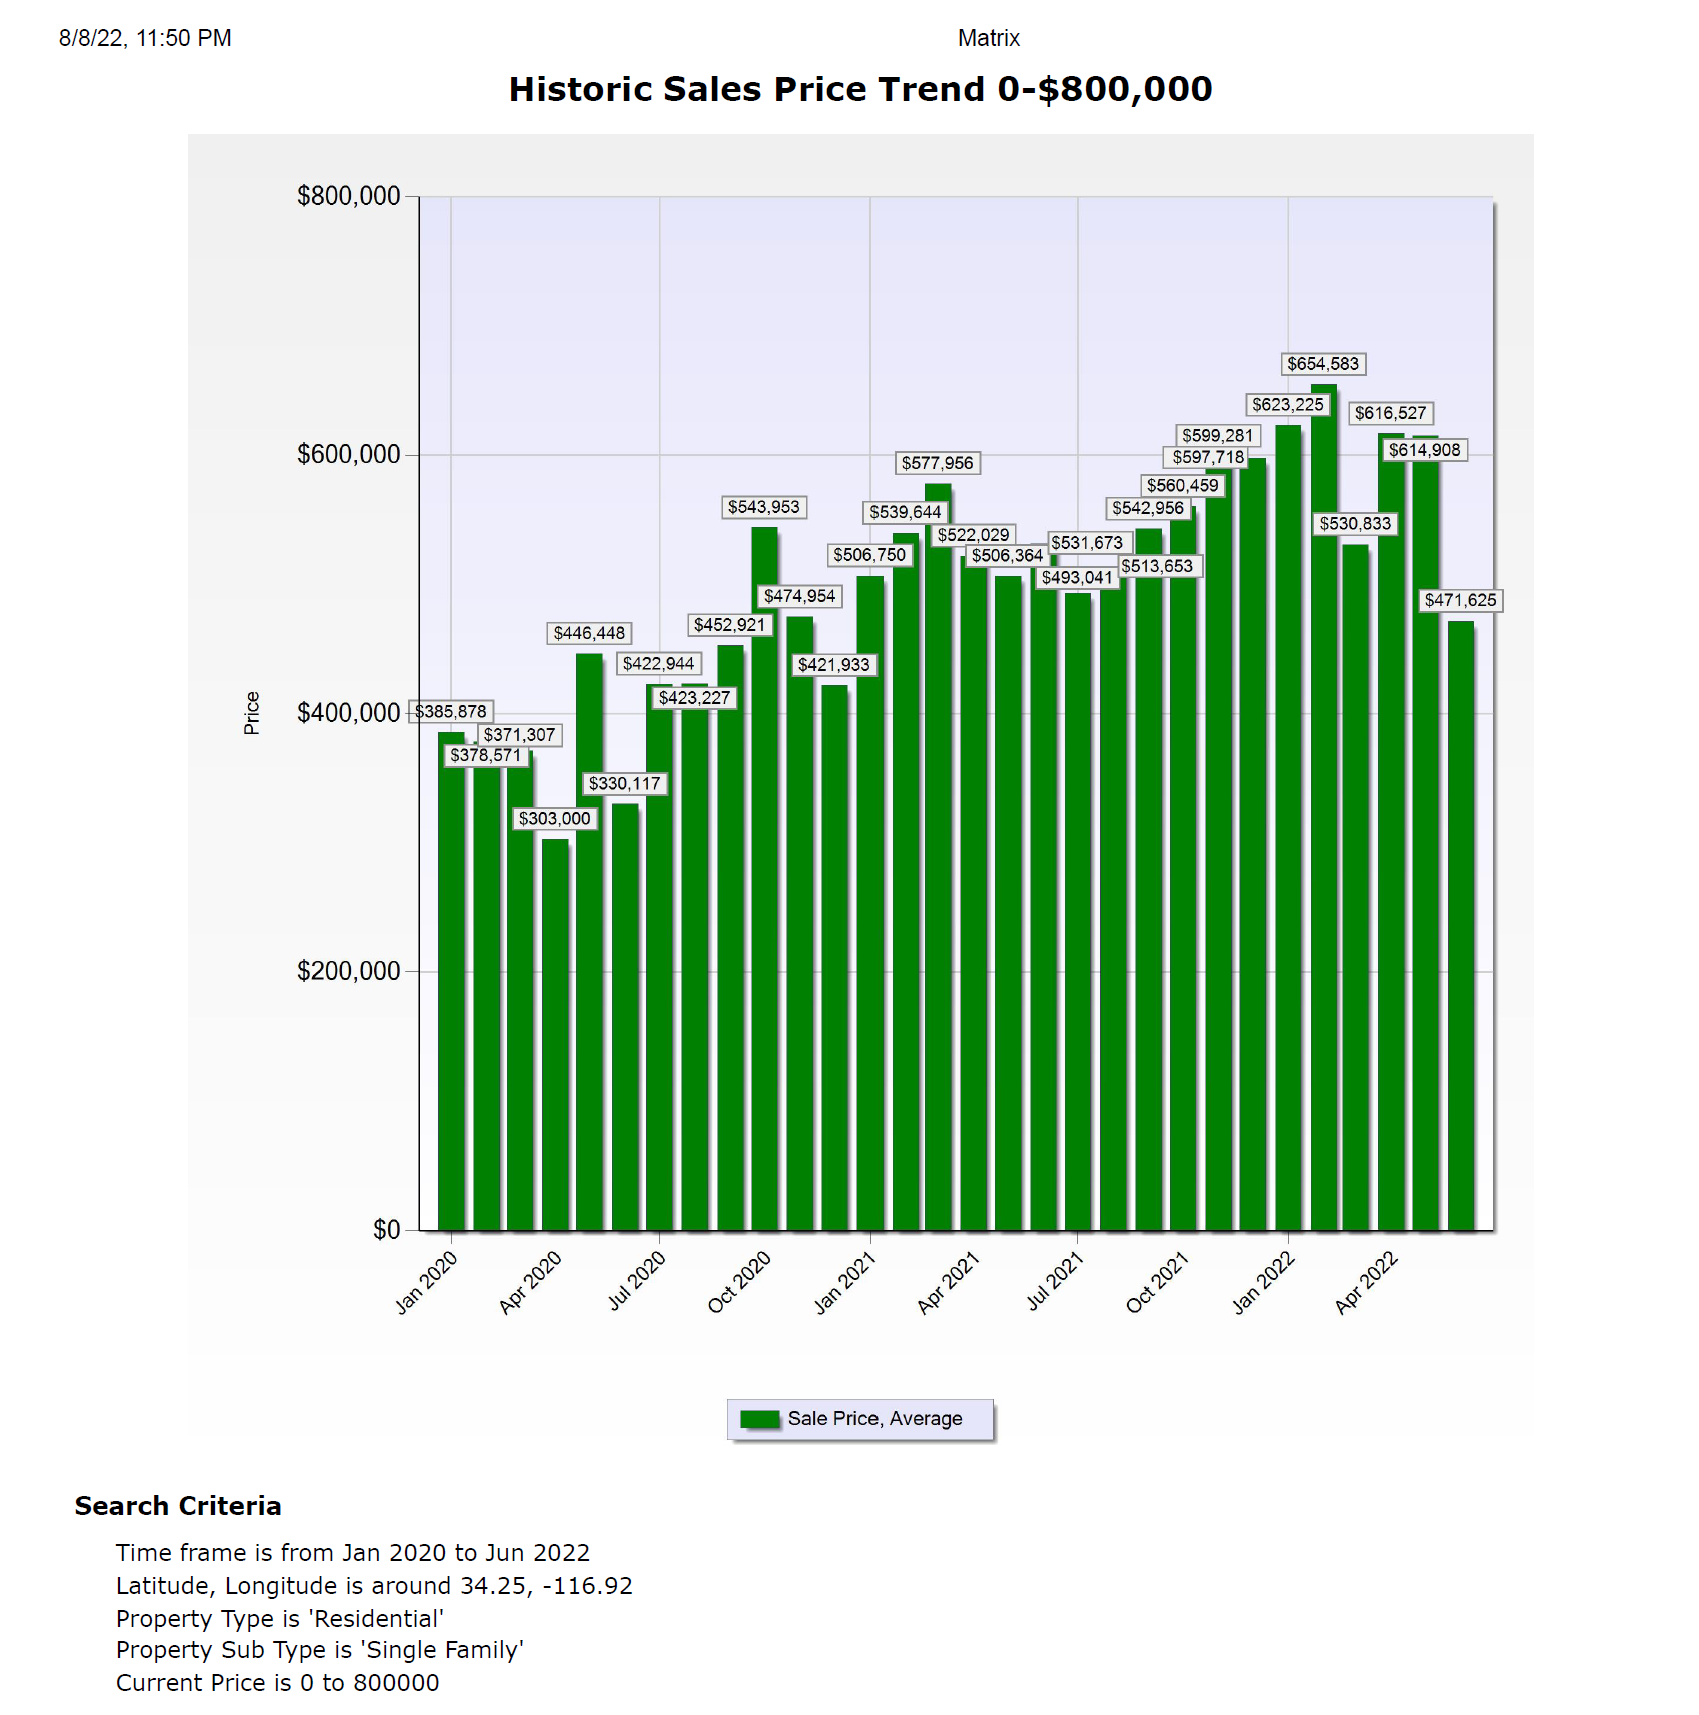
Like most of Big Bear, I have broken up the Big Bear Lake Front Area Market into two segments. Up to $800,000 property value and the luxury market over $800,000. This seems to be the most accurate price range to split the market. Every three months, I will post detailed quarterly market trend graphs for each price range with a condensed but easy to understand examinations of market stats. At the conclusion of our market report there will be a total market summary. All graphs are using a parameter of: Price Range $0 - $800,000, from January 2020 to March of 2022.
Table 1 Allows us to compare The Lake Front Area to The Big Three Areas, and the Sub Areas of Big Bear.
Graph 1 Shows what residential real estate price changes have occurred for the Lake Front Area on a monthly basis.
Graph 2 Shows what residential real estate price changes have occurred in the Lake Front Area on a annual basis.
Graph 1 When we use the information from Graph 2 and 3 we can see in this quarter the $471,000 price for June ranks the Lake Front Area in 8th place (or last place) out of 8 different categories in average price for 6/2022. And the $44,000 price deduction from 3 months ago is ranked 7th almost the lowest in Big Bear. Because of the lower loss the Lake Front Area still has a Gain of $160,000 over the past 2 years which ranks it second compared to the other 8 different categories. So the Lake Front area in this price range is doing very well.
While there will be fluctuations from quarter to quarter, but The Lake Front Area still has a good gain over the last 2 years, but I would expect this gain to be lowered over the next few quarters. . Most of the gain was in our Boom cycle. This gain will now continue to go down because we are in a down cycle and depending on the economy we will have to see how long this down cycle will last and how far prices will go down.


Graph 3 below shows us that listings are starting to go up while sales are staying as low as last quarter. This quarter we had 80 listings for the quarter with 27 sales while last year in the second quarter we had 109 listings with 40 sales. Comparing the second quarter of the last two years with the second quarter of 2020, we had 165 listings and 21 sales. But you have to remember that is when the boom just started. As you can see we are already catching up to last year in listings but sales are staying down. If this continues it will keep pressure on prices to continue to go down.

Graph 4 In the Lake Front area, the sales to expired ratios are still good with sales and expired listings close to a 1:1 ratio. There will always be expired listings. And a 1:1 ratio is considered a good ratio for a stable market.

Summary
With these numbers we can say that the second quarter started to show our reduction in prices and sales together with a increase in listings. We knew that this was coming with the slow down in the economy and a rise in interest rates because of inflation. Compared to The Big Three, The Lake Front Area rank’s second in average sales price for the month of 6/2022. And rank’s third in Average Loss from 3/2022 to 6/2022 which means The Lake Front Area’s rank in gain in price from 6/2020 to 6/2022 now comes in Second.
When we compare The Lake Front Area to the sub areas of Big Bear we rank fifth out of five in average price for the month of 6/2022. We rank Third out of five in average loss from 3/2022 to 6/2022 which means The Lake Front Area was in the middle of the loss column. Which brought our rank to the gain in price equal to The Fox Farm Area in a tie for First. From 6/2020 to 6/2022.
When compared to the rest of Big Bear The Lake Front Area is doing well and with fluctuations in the graphs I expect some of the rankings to be adjusted. And like the rest of the Big Bear Real Estate Market expect Prices to fall, listings to increase and Sales to go down through the rest of the year.
Lake Front Area Market Trends: $800,000 and Up Price Range
Graph 1 shows what residential real estate price changes have occurred for the Lake Front Area on a monthly basis.
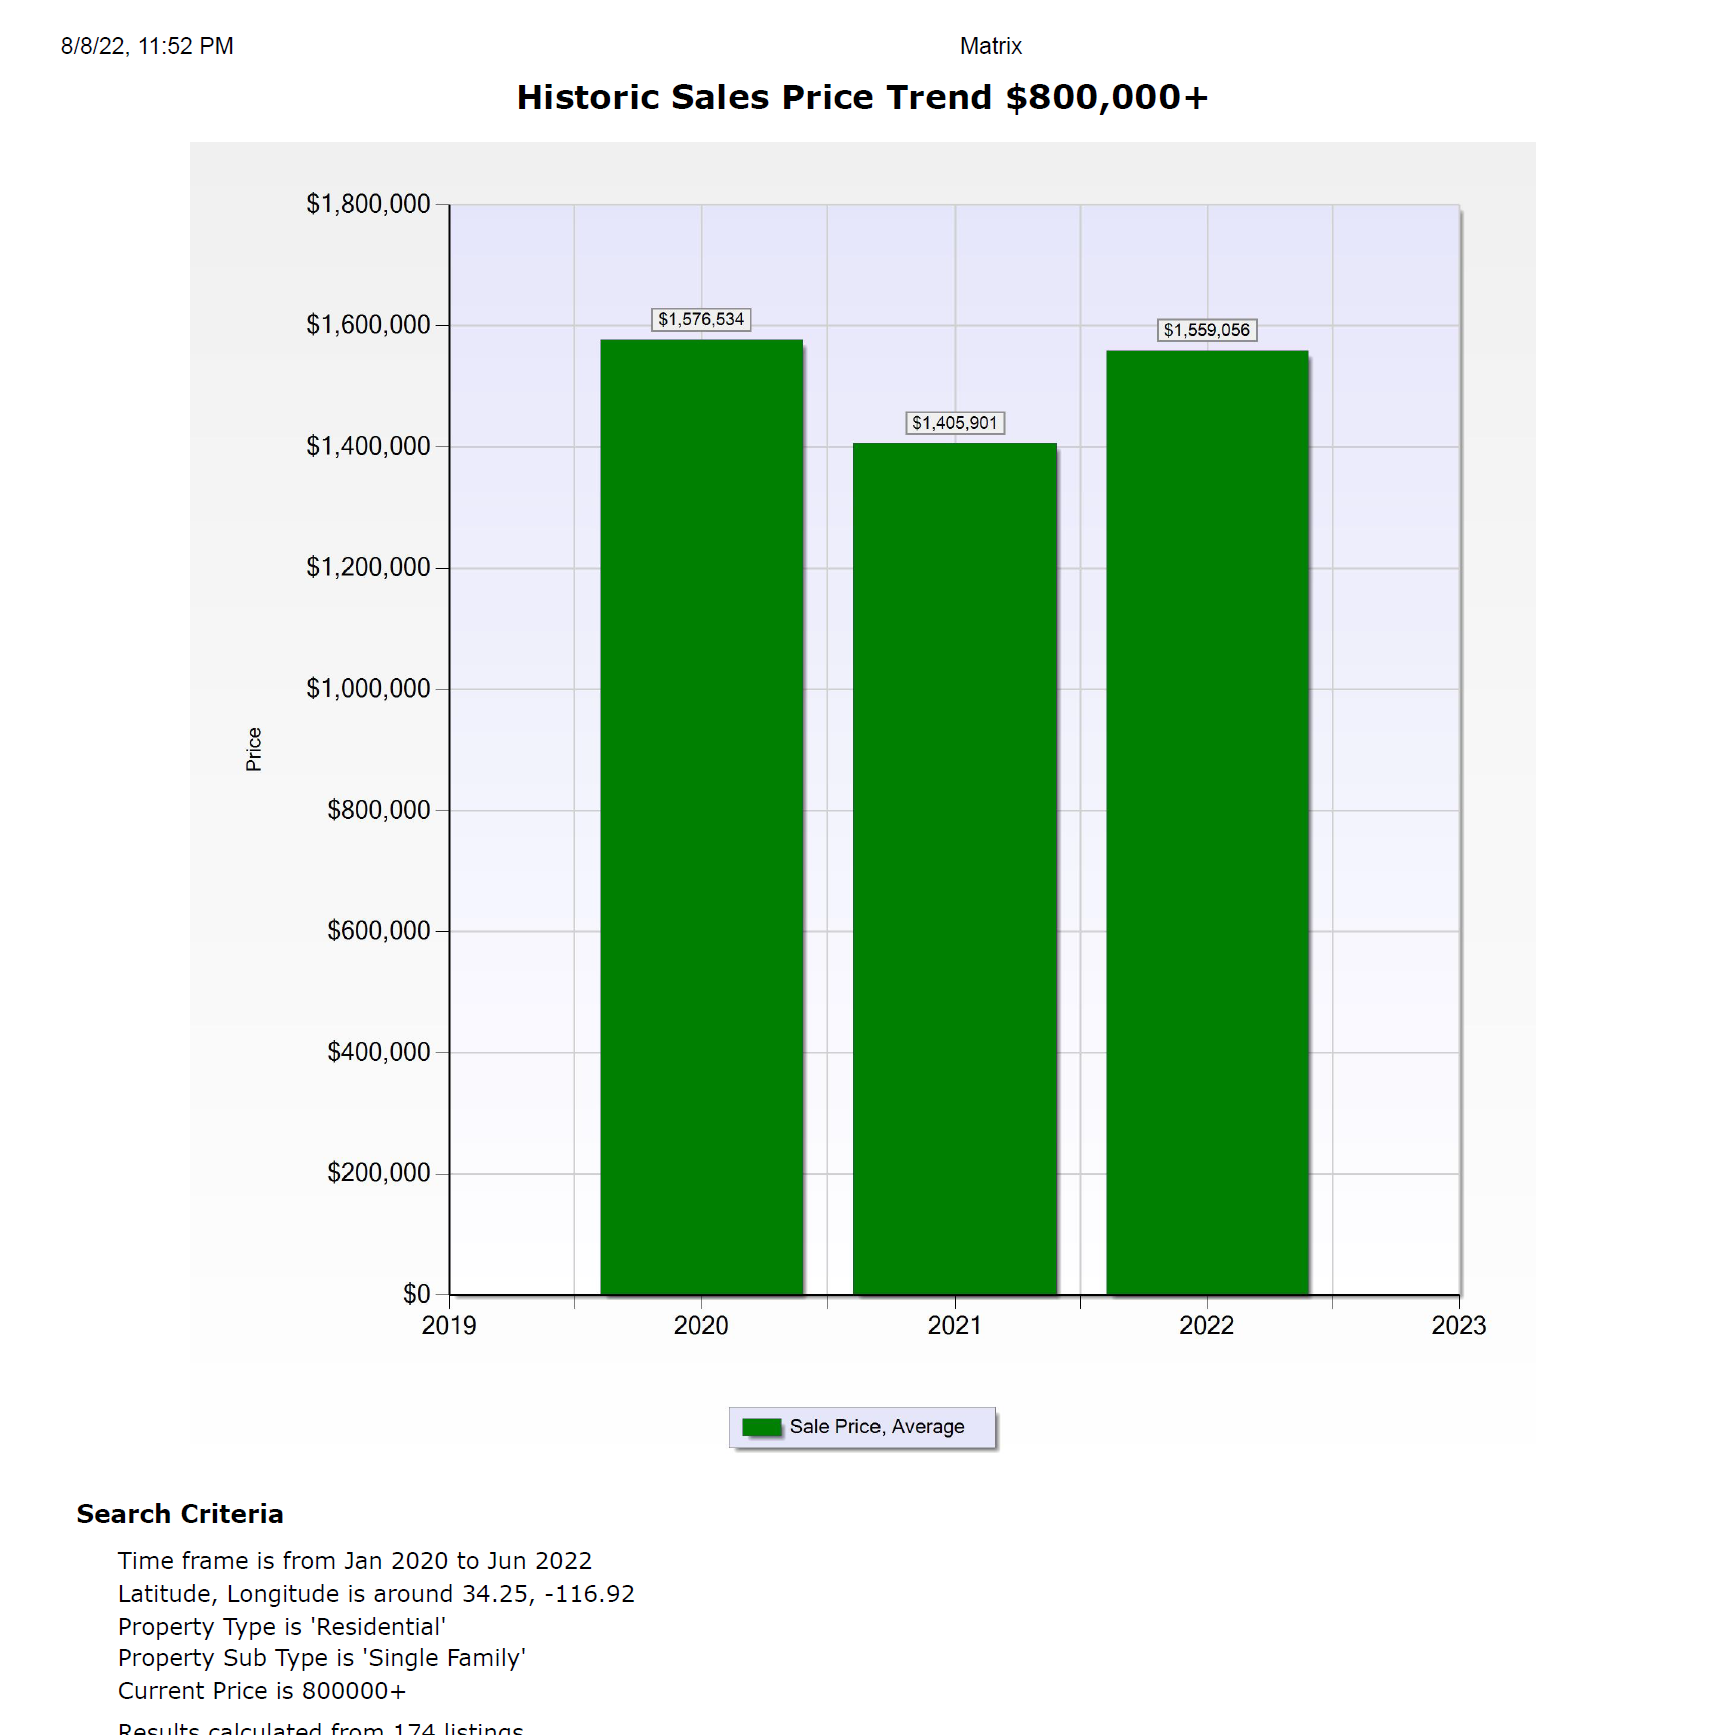
Graph 2 shows what residential real estate price changes have occurred for the Lake Front Area on a annual basis.
Both graphs are using a parameter of: Price Range $800,000 and up, from January 2020 to March of 2022.
In the Lake Front Area the second quarter of 2022 had a drop in average price to $1,422,000 for the month of March. Usually Lake Front Luxury prices are in the range of $1,300,000 to $2,000,000. Because of the sale of lake front cabins having such a premium price the Lake Front Area has some of the highest prices in Big Bear. And some of the highest swings from month to month. At least that is what we have been enjoying since January of 2020.
This is why if your cabin is in this price range and you want to know what your Big Bear cabin is worth, you have to get a more detailed market analysis, that takes into consideration number of Bedrooms, Bathrooms, Square Feet, Lot size, Condition and Views or location.

Graph 3 below shows us that listings are starting to go up while sales are staying as low as last quarter. This quarter we had 38 listings for the quarter with 14 sales while last year in the second quarter we had 48 listings with 15 sales. Comparing the second quarter of the last two years with the second quarter of 2020, we had 17 listings and 4 sales. But you have to remember that is when the boom just started. As you can see we are staying about even with last year in listings and starting to have sales go down. Look for listings to increase and sales to decrease for the rest of the year. But because of lake front sales prices will stay higher than most of Big Bear.

Graph 4 In the Moonridge area, the sales to expired ratios are still good with sales and expired listings close to a 1:1 ratio. There will always be expired listings. And a 1:1 ratio is considered a good ratio for a stable market.

Summary
With these numbers we can say that the first quarter had a significant drop in price. But I’ll say again you have to remember that this price range has wider price swings than the 0 - $800,000 market. By looking at the graphs you can see that we can have a month to month swing of $800,000 or more for different months. The nice part is that sales stayed at a good level. For vacation homes in a luxury market this is a nice market. In the 0-$800,000 market we would compare the big three areas of Big Bear Lake, The Total Big Bear Valley and Big Bear City. But in the luxury market I don’t use Big Bear City because of lack of sales in the $800,000 and up luxury market. So from what I can see the Lake Front Luxury market is higher in price and sales than most areas of Big Bear.
We now know that we are headed into a very different market. Economic data for the third quarter and beyond is all pointing to a slow down in the market. Read my post about the slow down, Selling In Today's New Market
Expect changes in the graphs for the third quarter and the rest of the year to better reflect the economy.
My opinion is that we are going to witness a more normal market. In order to get to that normal market prices may come down a little more. Cabins will be on the market a little longer. Sales will decline.