

Q2 Market Report - Over 800k
Total Big Bear Valley Luxury Market Trends: $800,000 And Over Price Range
Like most of Big Bear, I have broken up the Total Big Bear Market into two segments - Up to $800,000 property value and the luxury market over $800,000. This seems to be the most accurate price range to split the market. Every three months, I will post detailed quarterly market trend graphs for each price range with a condensed but easy to understand examinations of market stats. At the conclusion of our market report there will be a total market summary.
Graph 1 (below) shows what residential real estate price changes have occurred for the Total Big Bear Valley on a monthly basis using a parameter of: Price Range $800,000 and over, from January 2020 to March of 2022.
Graph 2 shows what residential real estate price changes have occurred for the Total Big Bear Valley on a annual basis.
In the Total Big Bear Valley Area the first quarter of 2022 continued with the price stability that we have been enjoying since January of 2020. What started out with an average price in January of 2020, of $1,137,500 has brought us to an average price of $1,289,306 in March of 2022. For an increase of $152,000. But you have to remember that this price range has wider price swings than the 0 - $800,000. By looking at the graphs you can see that we can have a month to month swing of $400,000 or more at times. So overall I would say that Total Big Bear Valley Area is on par with the rest of the Big Bear areas in this price range.
This is why if you want to know what your Big Bear cabin is worth in this price range, you have to get a more detailed market analysis that takes into consideration number of Bedrooms, Bathrooms, Square Feet, Lot size, Condition and Views or location.
As a side note I didn’t use the Big Bear City area because when we try and use the Big Bear City Market for a comparison there really isn’t that much data to use so we will just use the luxury numbers from the Big Bear Lake Area.


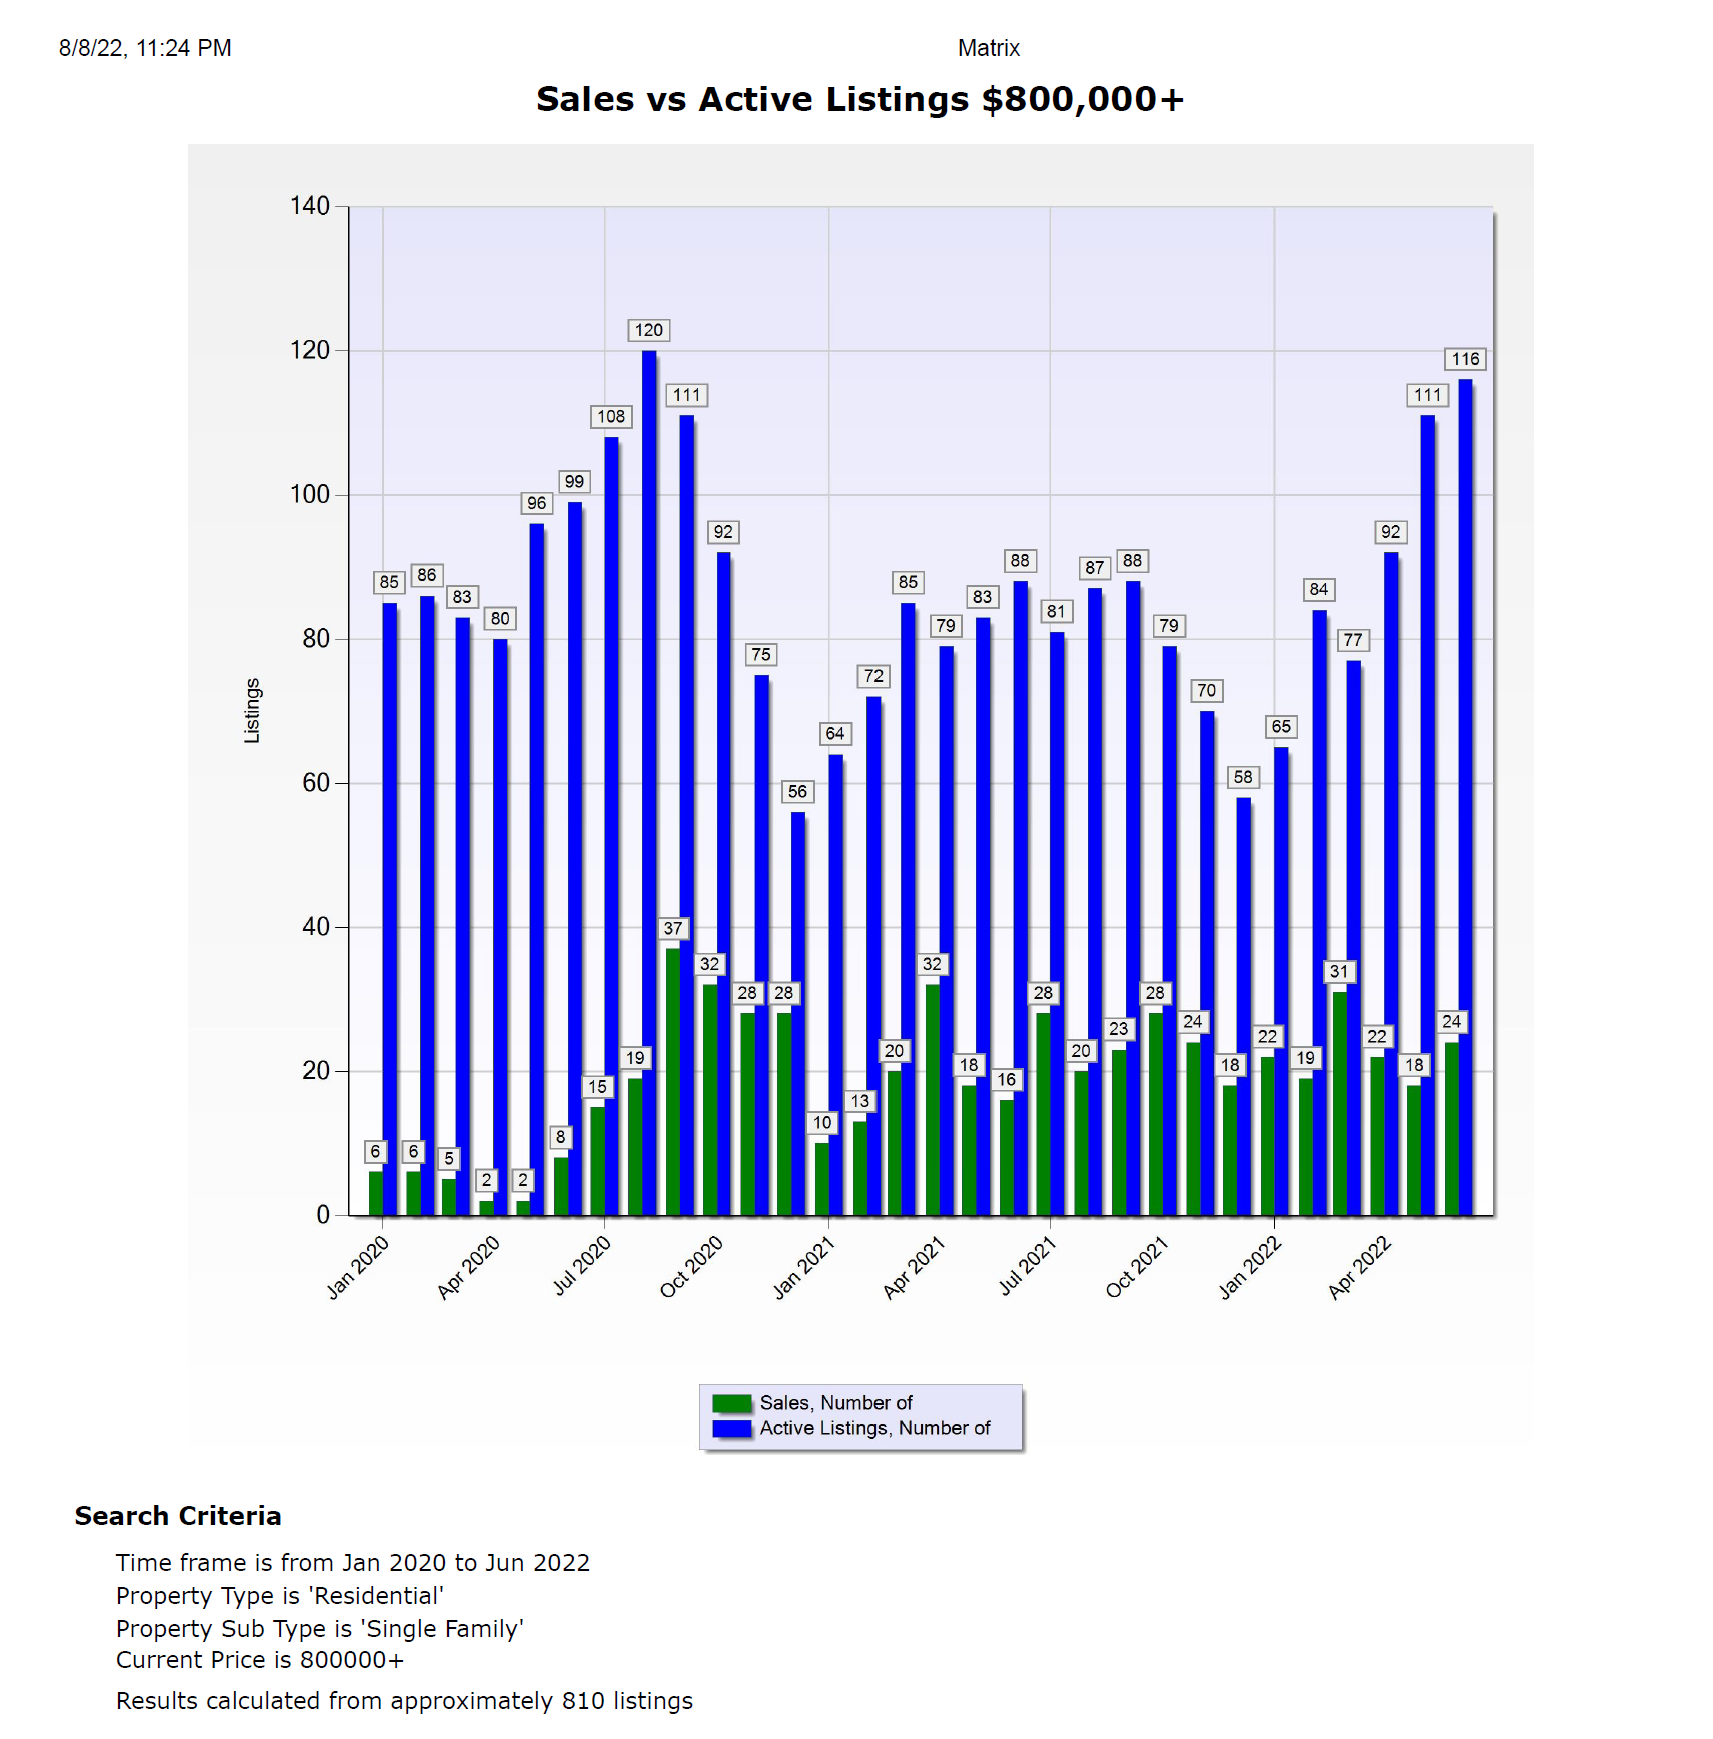
Graph 3 shows what residential real estate inventory changes (Sales vs Active listings) have occurred for the Total Big Bear Valley Area on a monthly basis using a parameter of: Price Range of $800,000 and over from January 2020 to March of 2022.
This quarter we had 319 listings and 64 sales. While last year we had 250 listings and 66 sales in the second quarter. Compare the last two years with 2020 second quarter of 275 listings and 12 sales remembering that this is just the start of the boom market. And you can see that the luxury market has been getting stronger every year. It is also worth noting that during 2019 and before we were lucky to have 2 or 3 sales in three months in this price range for the whole Big Bear market.
Graph 4 In the Total Big Bear Area, the sales to expired ratios are still good with sales and expired listings close to a 1:1 ratio. There will always be expired listings. And a 1:1 ratio is considered a good ratio for a stable market.

Summary
With these numbers we can say that the Second quarter had a significant drop in price. But I’ll say again you have to remember that this price range has wider price swings than the 0 - $800,000 market. By looking at the graphs you can see that we can have a month to month swing of $400,000 or more for different months. The nice part is that sales stayed at a good level. For vacation homes in a luxury market this is a nice market. In the 0-$800,000 market we would compare the big three areas of Big Bear Lake, The Total Big Bear Valley and Big Bear City. But in the luxury market I don’t use Big Bear City because of lack of sales in the $800,000 and up luxury market. So from what I can see the Moonridge Luxury market is on par with the rest of the areas in Big Bear with steady prices even though we took a big hit in the month of June.
We now know that we are headed into a very different market. Economic data for the third quarter and beyond is all pointing to a slow down in the market. Read my post about the slow down, Selling In Today's New Market
Expect changes in the graphs for the third quarter and the rest of the year to better reflect the economy.
My opinion is that we are going to witness a more normal market. In order to get to that normal market prices may come down a little more. Cabins will be on the market a little longer. Sales will decline.