Q2 Market Report - Big Bear Lake
Big Bear Lake Area Market Trends
Every three months, I will post detailed quarterly market trend tables made from three year graphs, for the Total Big Bear Area and 10 Sub Areas. Using the tables and graphs I will report the trends of Market Prices, Sales vs Active Listings, and Expired Listings and summarize what they mean to the current and future Total Big Bear Area and 10 Sub Areas Real Estate Markets. This section is for the Big Bear Lake Area. The following analysis is a detailed but easy to understand examination of these market trends.
The following stats have 2 sections. Section 1 up to $800,000 property value and Section 2 $800,000 and up, the Luxury Market. This seems to be the most accurate price range to split the market. If you want to just get the short version of the market in the Big Bear Lake Area, you can read the Overall Summary of both price ranges before section 1.
Section 1 notes: the Castle Glen, Eagle Knolls and Eagle Point/Eagle Point Estates Areas are not included in section 1 stats due to the fact that there aren’t any sales under $800,000 in these areas.
Section 2 notes: the possibility of wide swings in monthly and quarterly market prices in the $800,000 And Up Luxury Market.
Up To $800,000 Overall Summary
Market Prices in the second quarter of 2024 there was an decrease in Price of $56,000 (-11%) in average monthly price compared to the average monthly price for the first quarter of 2024. . There was also a decrease in price of $66,000 (-13%) from 1 year ago and a decrease in price of $84,000 (-16%) from 3 years ago.
Area Ranking The 2024 second quarter average monthly price of $513,000 gives the Big Bear Lake Area a ranking of 3rd highest in price out of the 7 sub areas for this price range, for the Total Big Bear Market. We also see in this quarter the Big Bear Lake Area has a $66,000 (+13%) higher average monthly price compared to the Total Big Bear average monthly price of $448,000.
Sales and Listings in the second quarter of 2024 there was a average monthly decrease in sales of 5 per month and a increase of 43 listings per month, compared to the first quarter of 2024. There was also a decrease of 8 Sales per month and a increase of 29 listings compared to 1 year ago. We also had a decrease of 12 sales per month and a increase of 34 listings per month compared to 3 years ago.
Expired Listings have been steady at a ratio of 1:1 and 1:2 as normal. With all the new listings we will see how long that lasts. We should see a higher ration of expired listings this fall and winter.
These numbers show us that the economic influences of higher rates and inflation have affected prices compared to the last quarter, 1 year ago and 3 years ago.
When looking at the data of the Big Bear Lake Area the two big areas of market influence to watch are of course interest rates and the number of listings that come on the market. We just had a 1% drop in mortgage interest rates. Which is great news. The question is will this be enough to bring sales back up to a higher level which should at least stop prices from going down any more?
$800,000 And Up Luxury Market Overall Summary
Market Prices in the second quarter of 2024 there was an increase in Price of $234,000 (+17%) in average monthly price compared to the average monthly price for the first quarter of 2043. There was also a decrease in price of $34,000 (-3%) from 1 year ago and a increase in price of $104,000 (+8%) from 3 years ago.
Area Ranking The 2024 second quarter average monthly price of $1,345,000 gives the Big Bear Lake Area a ranking of 5th highest in price out of the 10 sub areas for this price range, for the Total Big Bear Market. We also see in this quarter the Big Bear Lake Area has a $51,000 (+4%) higher average monthly price compared to the Total Big Bear average monthly price of $1,294,000.
Sales and Listings in the second quarter of 2024 there was a average monthly decrease in sales of 1 per month and a increase of 15 listings per month, compared to the first quarter of 2024. There was also Sales staying the same at 6 per month and a increase of 14 listings compared to 1 year ago. We also had a decrease of 9 sales per month and a increase of 3 listings per month compared to 3 years ago.
Expired Listings the sales to expired ratio for the last three years have been up and down like prices in this price range. We are usually at a 1:1 to 1:2 ratio with sales and expired listings. Where in the summer we have a 1:1 ratio, and in the fall and winter we have a 1:2 ratio. Right now we are in a normal market for this price range overall. But with an increase in listings there may be pressure for expired listings to go up which can cause prices to come down.
These numbers show us that the economic influences of higher rates and inflation have affected prices, sales and listings in a negative way.
When looking at the data of the Big Bear Lake Area the two big areas of market influence to watch are of course interest rates and the number of listings that come on the market. We just had a 1% drop in mortgage interest rates. Which is great news. The question is will this be enough to keep sales at a normal level which should at least keep prices from going down even more?
Section 1 Up To $800,000
Market Prices
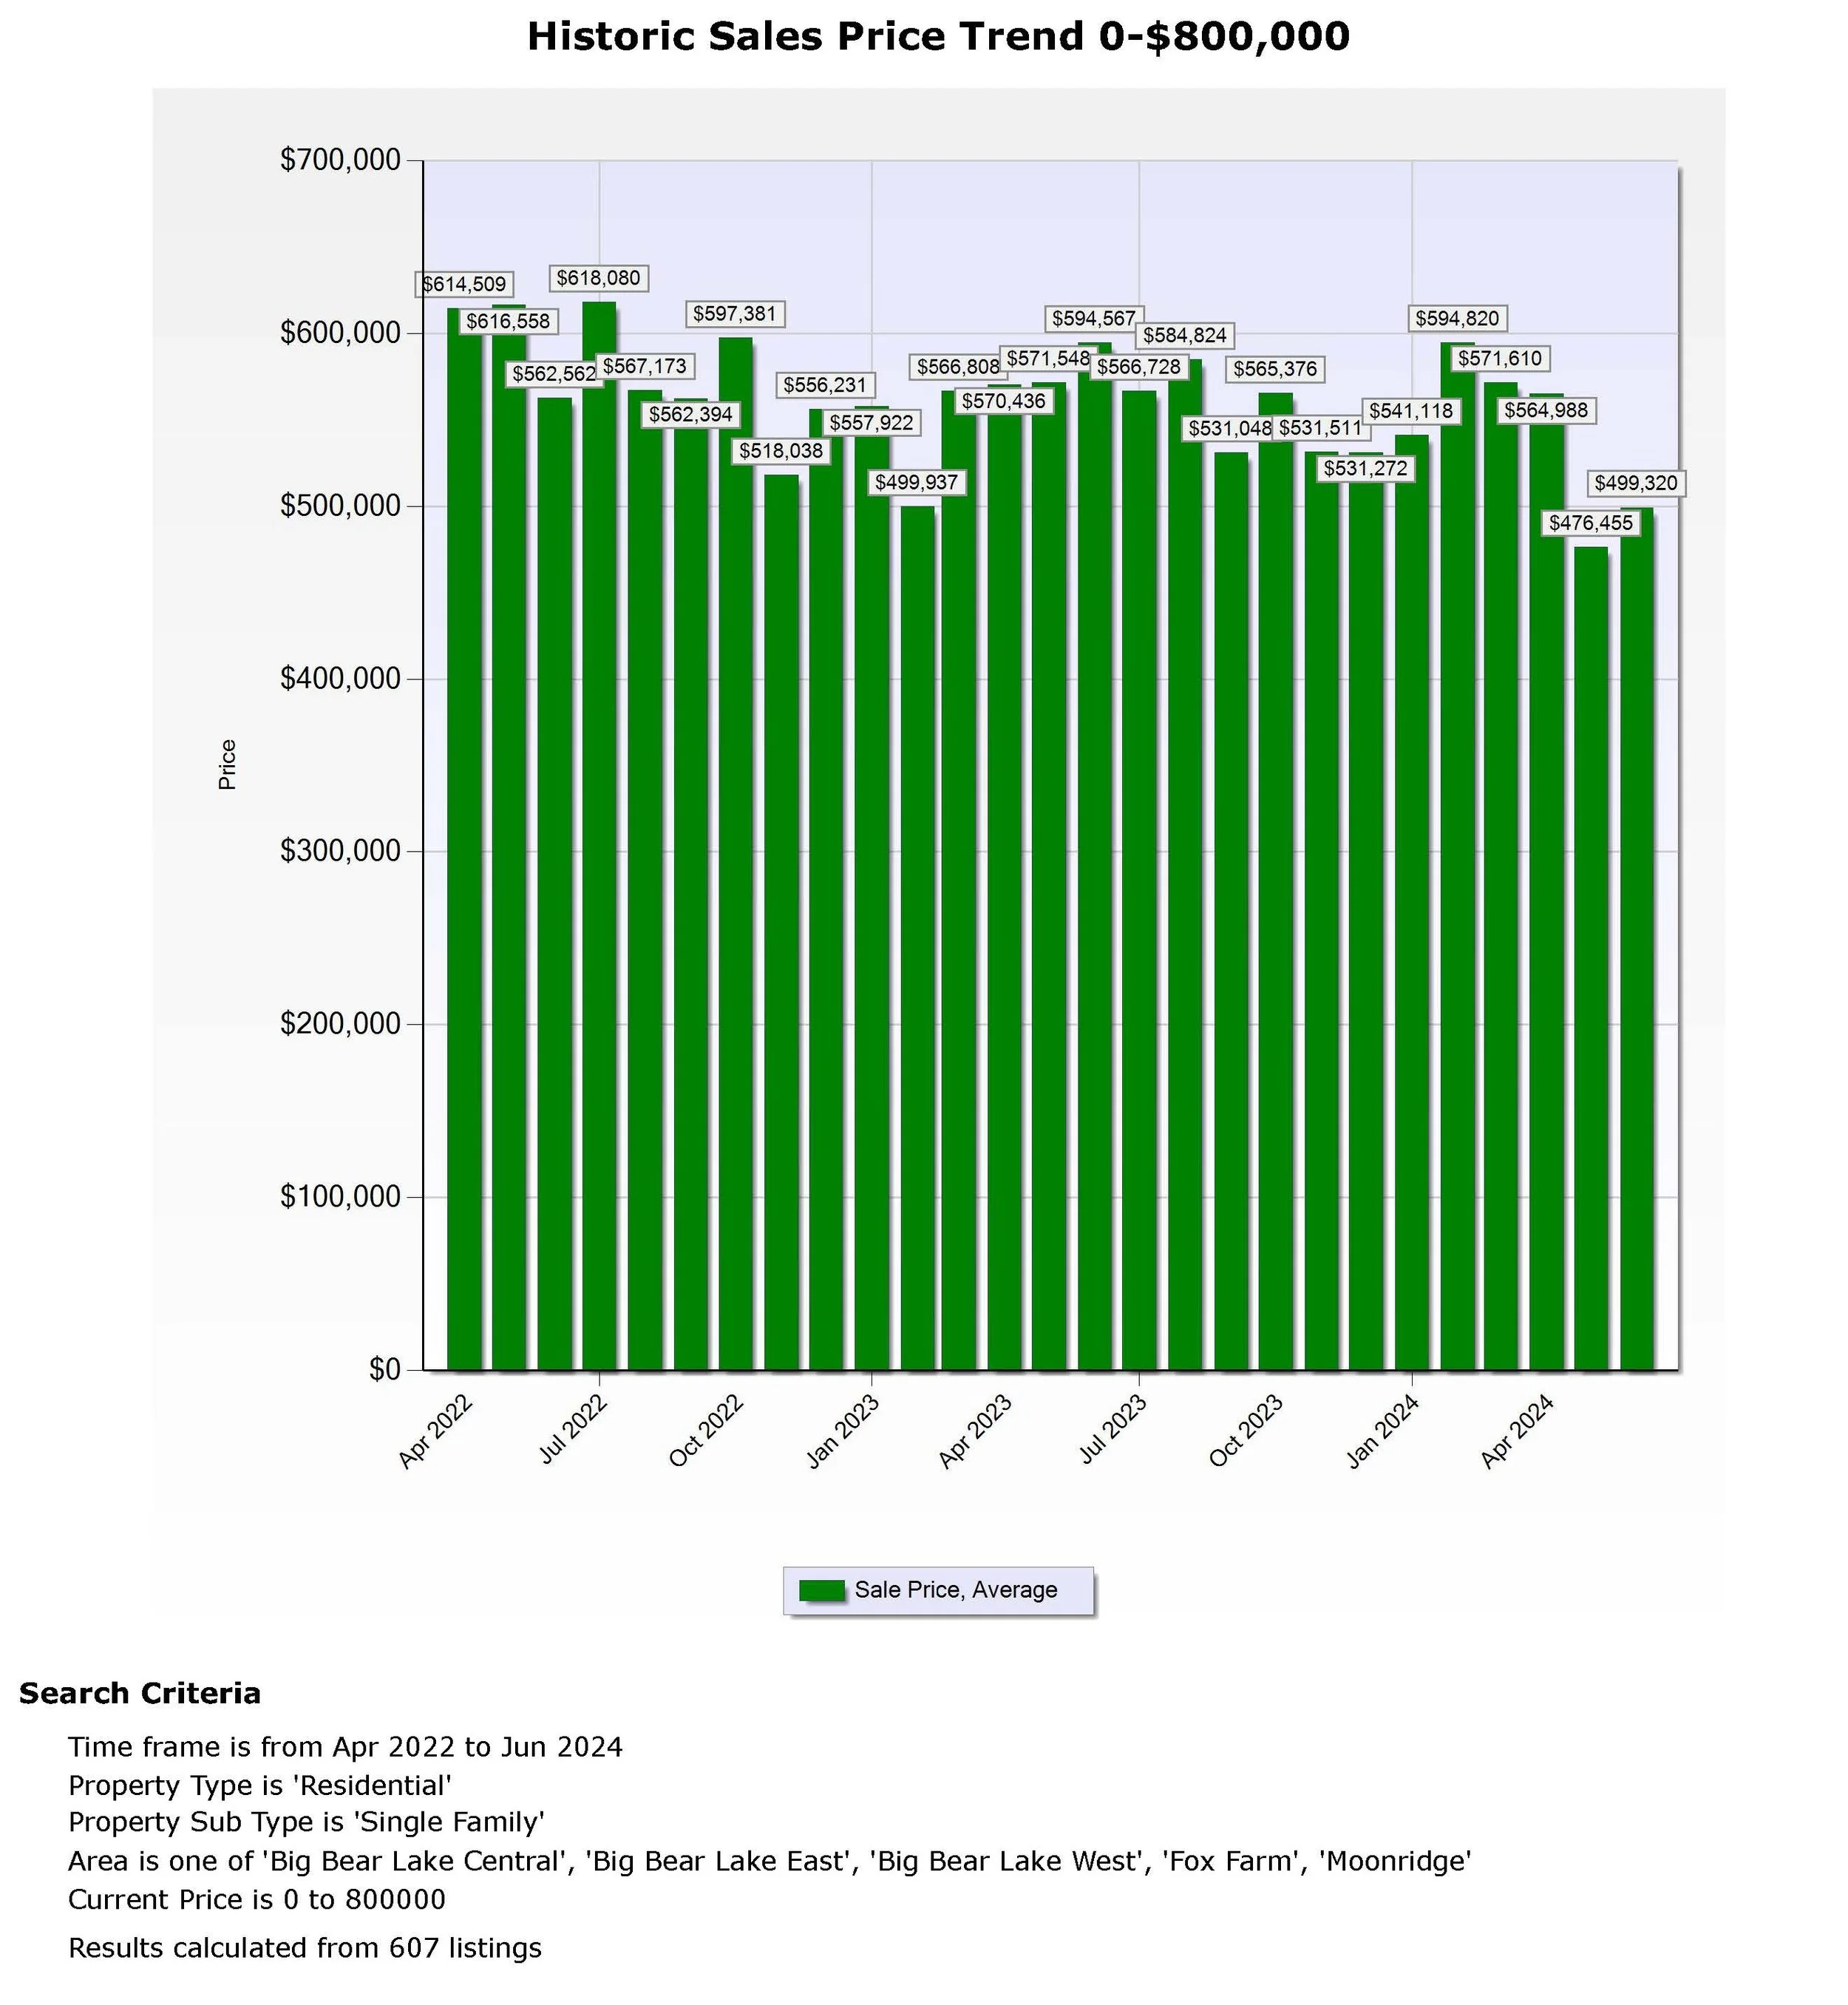
Last Quarter Market Trends The 2024 average monthly price for the second quarter of $513,000 was down $56,000 from the 2024 first quarter average monthly price of $569,000.
1 Year Market Trends The 2024 average monthly price for the second quarter of $513,000 was down $66000 from the 2023 second quarter average monthly price of $579,000.
3 Year Market Trends The 2024 average monthly price for the second quarter of $513,000 was down $84,000 from the 2022 second quarter average monthly price of $598,000.
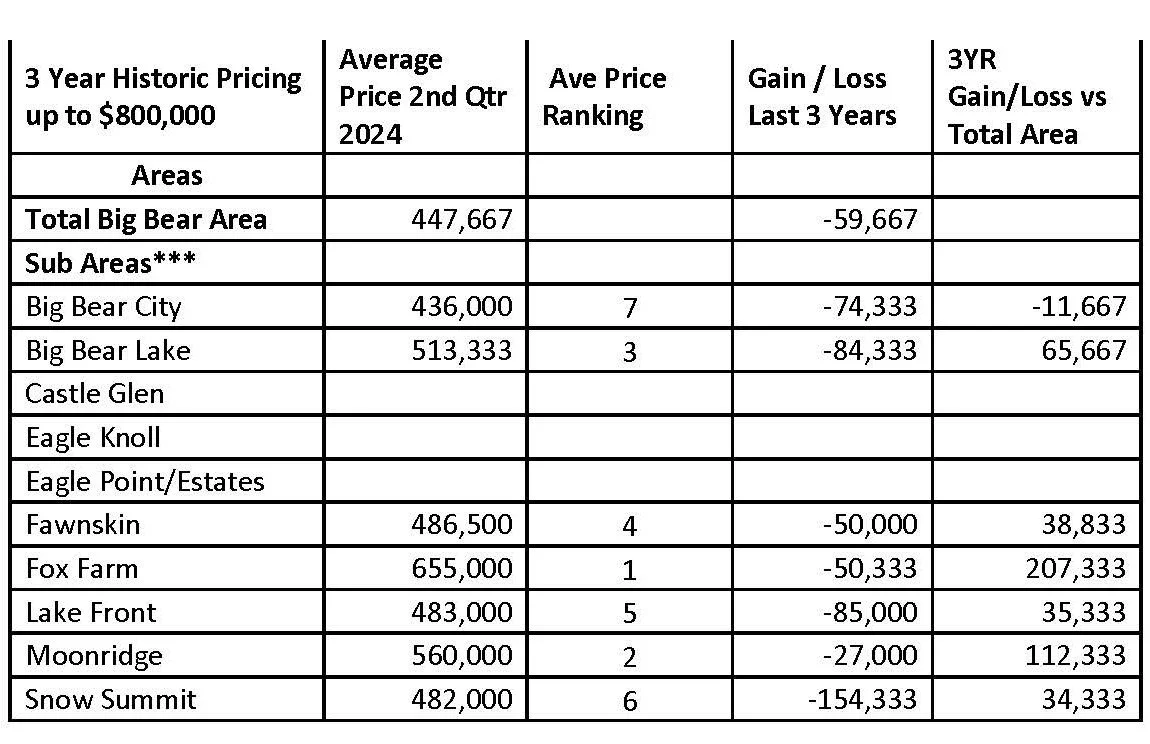
Area Ranking The 2024 second quarter average monthly price of $513,000 gives the Big Bear Lake Area a ranking of 3rd highest in price out of the 7 sub areas for this price range, for the Total Big Bear Market. We also see in this quarter the Big Bear Lake Area has a $66,000 higher average monthly price compared to the Total Big Bear average monthly price of $448,000.
Total Big Bear Area $448,000
The sub areas ranked as follows:
Fox Farm $655,000
Moonridge Area $560,000
Big Bear Lake Area $513,000
Fawnskin Area $487,000
Lake Front Area $483,000
Snow Summit $482,000
Big Bear City Area $436,000
Price Summary These numbers shows us that compared to last quarter the economic influences of higher rates and inflation have affected prices in a negative way with prices down $56,000. When compared to 1 year ago prices are down $66,000. And when compared to 3 years ago prices are down $84,000. We just had a 1% drop in mortgage interest rates. Which is great news. The question is will this be enough to stop prices from falling?
If you want to know what your Big Bear Lake cabin is worth in this price range, contact me to get a more detailed market analysis that takes into consideration the number of Bedrooms, Bathrooms, Square Feet, Lot size, Condition, Views and location.

Sales vs Active Listings (supply and demand)
Last Quarter The second quarter of 2024 had average monthly sales of 11 per month. Which was a decrease of 5 sales per month when compared to the sales of 16 per month for the first quarter of 2024. The average number of listings per month for the second quarter of 2024 was 129 which is 43 per month more when compared to the 86 average monthly listings for the first quarter of 2024.
1 Year Average The second quarter of 2024 had average monthly sales of 11 per month. Which was a decrease of 8 sales per month when compared to the sales of 19 per month in the second quarter of 2023. The average number of listings per month for the second quarter of 2024 was 129 which is 29 per month more when compared to the 100 average number of listings for the second quarter of 2023.
3 Year Average The second quarter of 2024 had average monthly sales of 11 per month. Which was a decrease of 12 sales per month when compared to the sales of 23 per month in the second quarter of 2022. The average number of listings per month for the second quarter of 2024 was 129 which is 34 per month more when compared to the 95 average monthly listings for the second quarter of 2022.
Sales vs Active Listings Summary These numbers show us that compared to last quarter the economic influences of higher rates and inflation have affected sales and listings in a negative way with sales down 5 and listings up 43. And when compared to to 1 year ago sales are down 8 and listings are up 29. And when compared to 3 years ago sales are down 12 and listings are up 29. We just had a 1% drop in mortgage interest rates. Which is great news. The question is will this be enough to bring sales back up to a higher level?


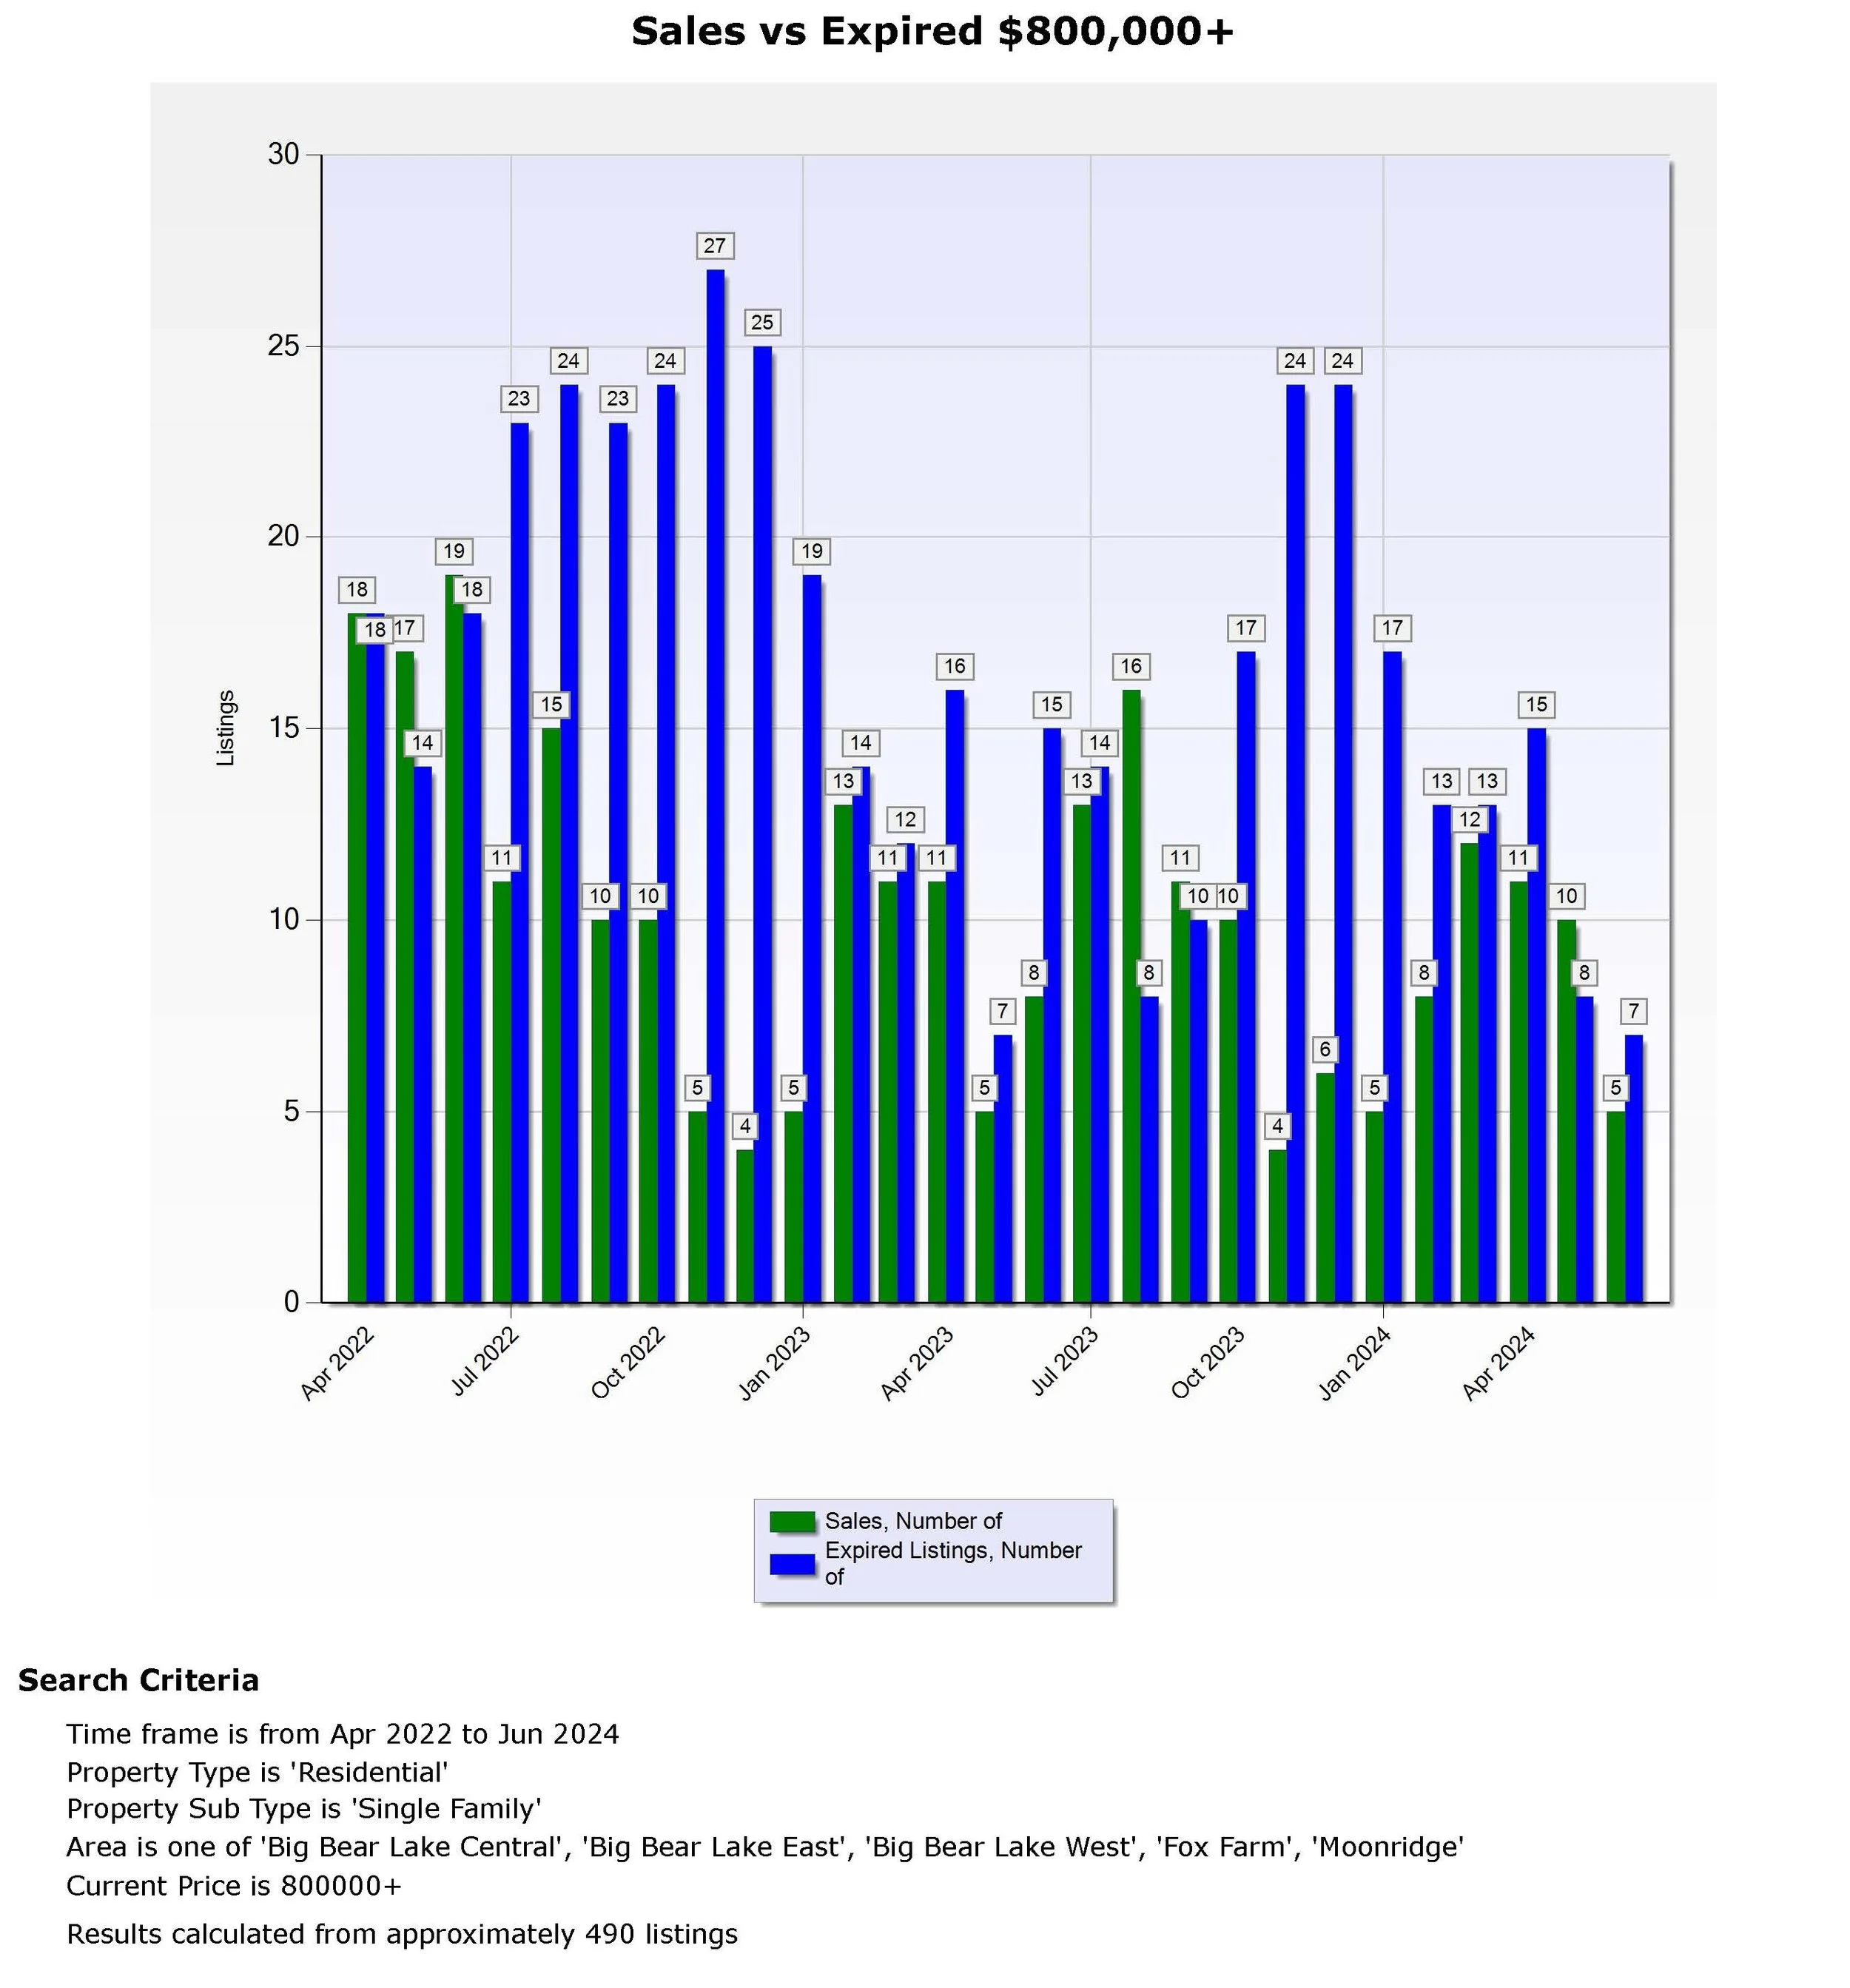
Sales vs Expired Listings (strength of sales)
Sales Vs Expired Market Trends Graph 3 In the Big Bear Lake Area, the sales to expired ratios for the last three years have been at a good level with sales and expired listings close to a 1:1 ratio. Where a 1:1 ratio is considered a good ratio for a stable market. Starting in October, and through April we stayed in a 1:2 ratio. This is a normal pattern. You can see from the graph this also happen before. So far we haven’t seen a surge in Expired listings but with the increase we just had in listings we may see a lot more expired listings. Which could put pressure on prices to go down.
We just had a 1% drop in mortgage interest rates. Which is great news. The question is will this be enough to bring sales back up to a higher level which should keep expired listings at their normal ratios?

Section 2 $800,000 And Up (Luxury Market)
Market Prices
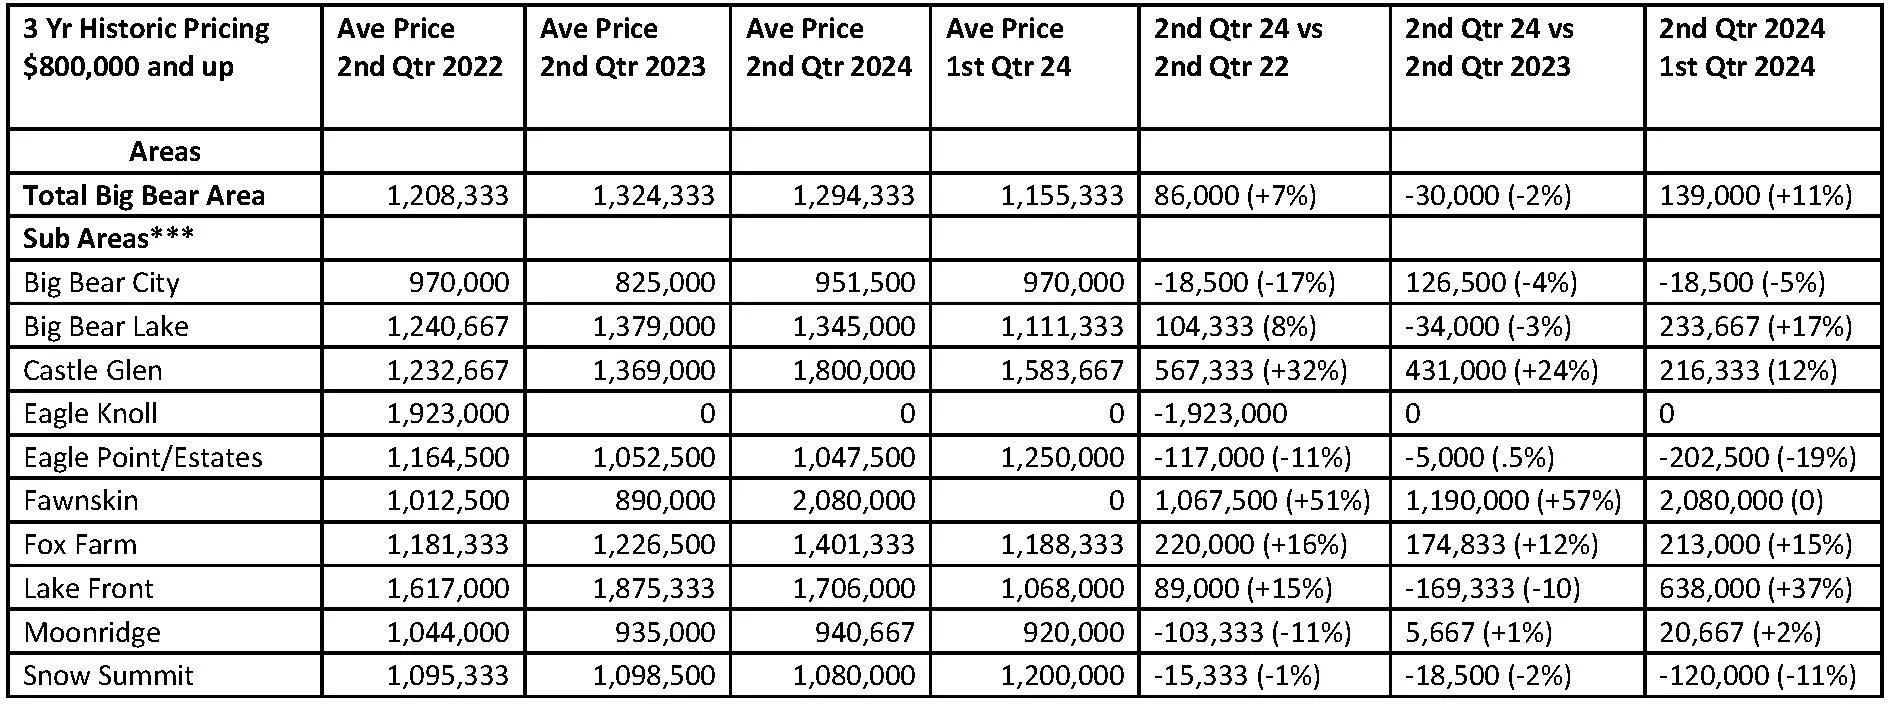
Last Quarter Market Trends the 2024 average monthly price for the second quarter of $1,345,000 was up $234,000 from the 2024 first quarter average monthly price of $1,111,000.
1 Year Market Trends The 2024 average monthly price for the second quarter of $1,345,000 was down $34,000 from the 2023 second quarter average monthly price of $1,379,000.
3 Year Market Trends The 2024 average monthly price for the second quarter of $1,345,000 was up $104,000 from the 2022 second quarter average monthly price of $1,241,000.
Area Ranking The 2024 second quarter average monthly price of $1,345,000 gives the Big Bear Lake Area a ranking of 5th highest in price out of the 10 sub areas for this price range, for the Total Big Bear Market. We also see in this quarter the Big Bear Lake Area has a $51,000 higher average monthly price compared to the Total Big Bear average monthly price of $1,294,000.
Eagle knolls didn’t have any sales in the first quarter of 2024.
Total Big Bear Area $1,294,000
The sub areas ranked as follows:
Fawnskin Area $2,080,000
Castle Glen Area $1,800,000
Lake Front Area $1,706,000
Fox Farm Area $1,401,000
Big Bear Lake Area $1,345,000
Snow Summit Area $1,080,000
Eagle Point/Estates $1,048,000
Big Bear City $952,000
Moonridge Area $941,000
Eagle Knoll $0
Price Summary These numbers shows us that compared to last quarter the economic influences of higher rates and inflation have not affected prices in a negative way with prices up $234,000. When compared to 1 year ago prices are down $34,000. And when compared to 3 years ago prices are up $104,000. We just had a 1% drop in mortgage interest rates. Which is great news. The question is will this be enough to at least stop prices from going down?
Remember the possibility of wide swings in monthly and quarterly market prices in the $800,000 and up Luxury Market. See the first graph below “Historic Sales Price Trend $800,000+”.
If you want to know what your Big Bear Lake cabin is worth in this price range, contact me to get a more detailed market analysis that takes into consideration the number of Bedrooms, Bathrooms, Square Feet, Lot size, Condition, Views and location.


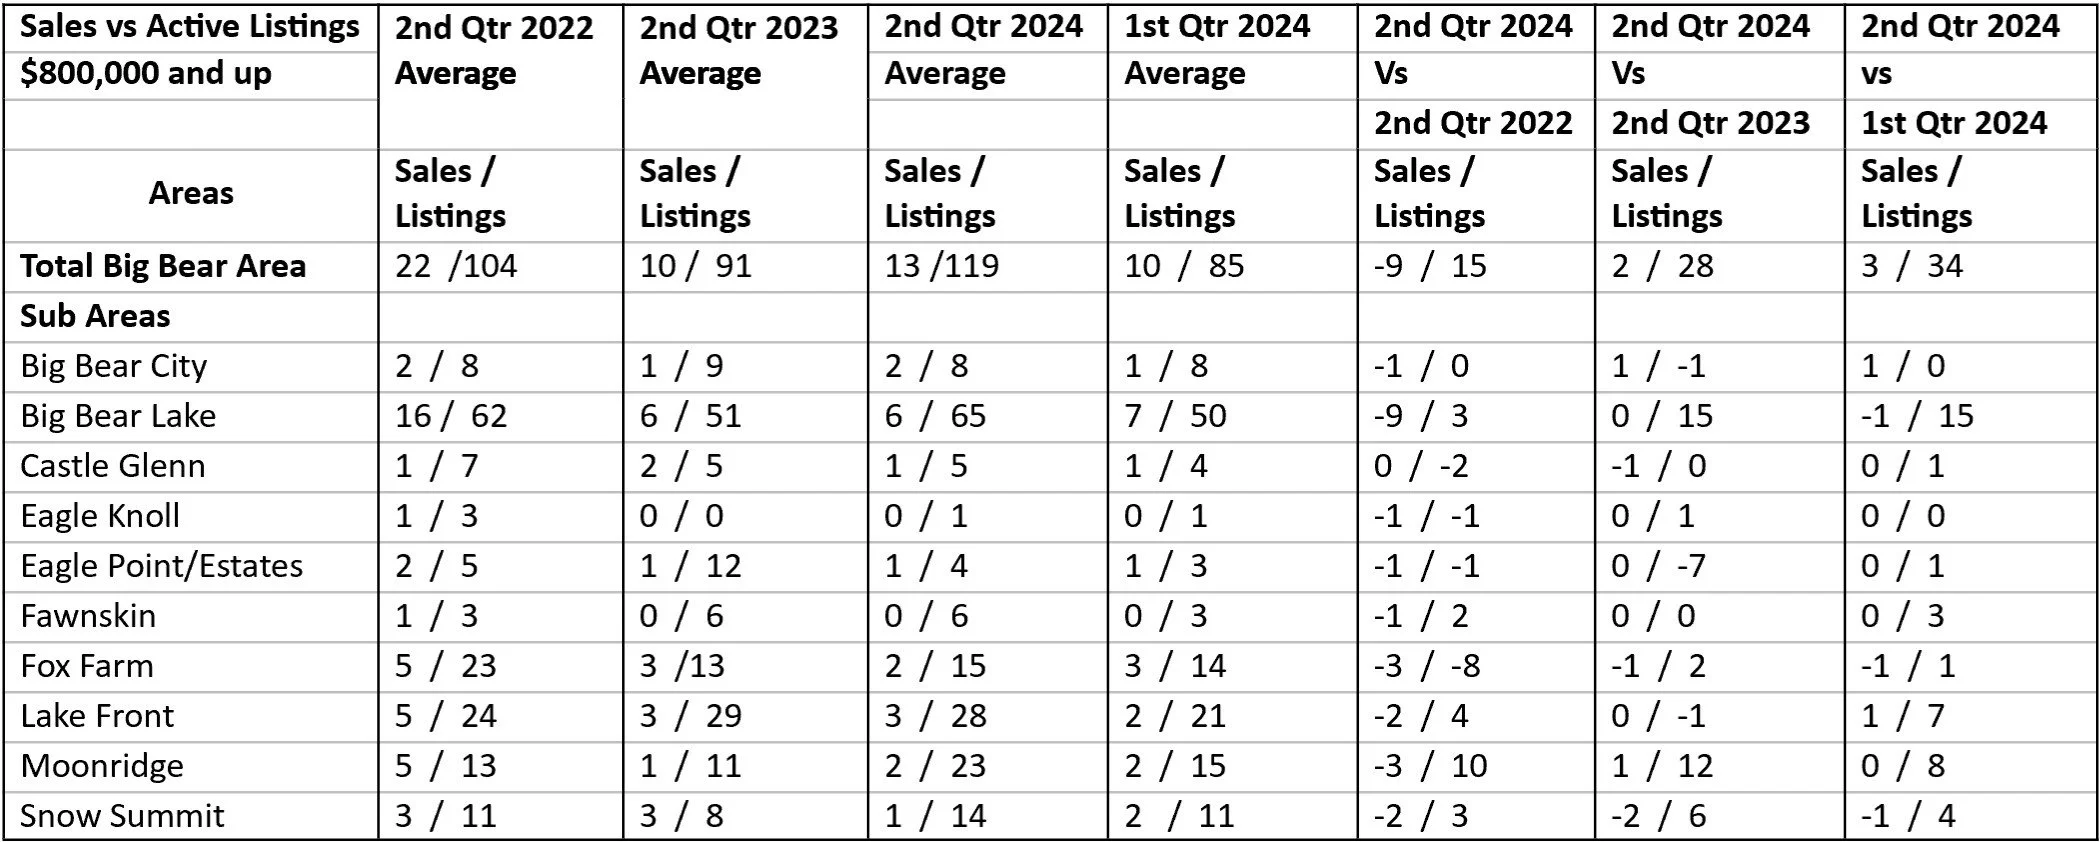
Sales vs Active Listings (supply and demand)
Last Quarter The second quarter of 2024 had average monthly sales of 6 per month. Which was a decrease of 1 sale per month when compared to the sales of 7 per month for the first quarter of 2024. The average number of listings per month for the second quarter of 2024 was 65 which is 15 per month more when compared to the 50 average monthly listings for the first quarter of 2024.
1 Year Average The second quarter of 2024 had average monthly sales of 6 per month. Which was the same sales per month when compared to the sales of 6 per month in the second quarter of 2024. The average number of listings per month for the second quarter of 2024 was 65 which is 14 per month more when compared to the 51 average number of listings for the second quarter of 2023.
3 Year Average The second quarter of 2024 had average monthly sales of 6 per month. Which was a decrease of 10 sales per month when compared to the sales of 16 per month in the second quarter of 2022. The average number of listings per month for the second quarter of 2024 was 65 which is 3 per month more when compared to the 62 average monthly listings for the second quarter of 2022.
Sales vs Active Listings Summary These numbers show us that compared to last quarter the economic influences of higher rates and inflation have affected sales and listings in a negative way with sales down 1 and listings up by 15. And when compared to to 1 year ago sales are the same at 6 per month. When compared to 3 years ago sales are down 10 and listings are up 3. We just had a 1% drop in mortgage interest rates. Which is great news. The question is will this be enough to bring sales back up to a higher level?
It is also worth noting that during 2019 and before we were lucky to have 2 or 3 sales in three months in this price range for the Total Big Bear Area market. Where in the fourth quarter of 2023 the Big Bear Lake Area averaged 4 Sales per month.

Sales vs Expired Listings (strength of sales)
Sales Vs Expired Market Trends Graph 6 In the Big Bear Lake Area, the sales to expired ratio for the last three years have been up and down like prices in this price range. We are usually at a 1:1 to 1:2 ratio with sales and expired listings. Where in the summer we have a 1:1 ratio, and in the fall and winter we have a 1:2 ratio. Right now we are in a normal market for this price range overall. But with an increase in listings there may be pressure for expired listings to go up which can cause prices to come down. We just had a 1% drop in mortgage interest rates. Which is great news. The question is will this be enough to bring sales back up to a normal level which should stop expired listings from going up?