

Q3 Market Report - Snow Summit
Snow Summit Area Market Trends: $0-$800,000 Price Range
The following stats are for the Snow Summit Area. I have divided the Total Big Bear Area into 10 Sub Areas also to give you more detailed information on the area where your property is located. Like most of Big Bear, I have broken up the Snow Summit Market into two segments Up to $800,000 property value and the Luxury Market over $800,000. This seems to be the most accurate price range to split the market. Every three months, I will post detailed quarterly market trend tables and graphs for each price range with a condensed but easy to understand examinations of the market stats. If you want to just get the short version you can skip to the bottom and read the Summary.
Market Prices
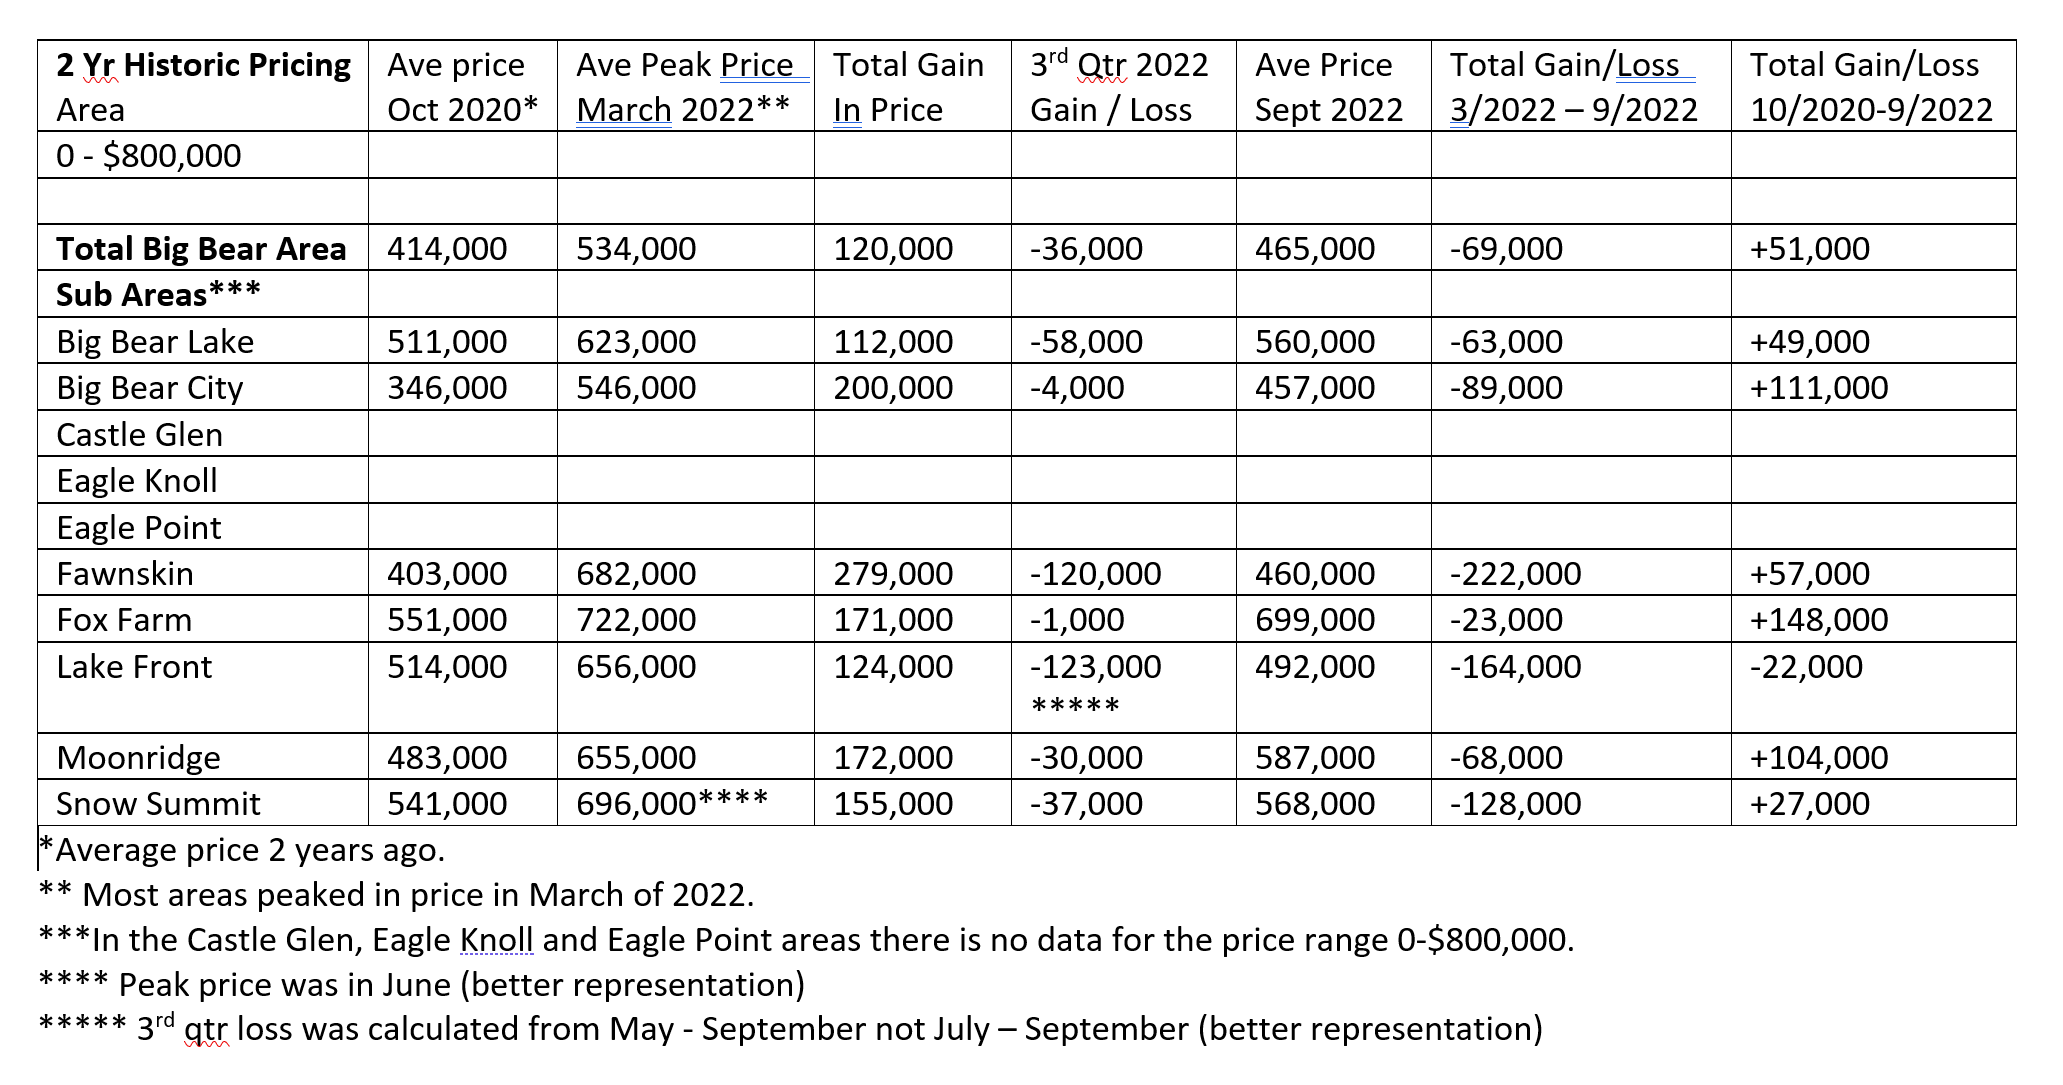
Table 1 (below) was created from the two year average price monthly graphs for the Total Big Bear Area and the 10 sub areas from October 2020 to September 2022. Graph 1 below covers the Snow Summit Area. I will be using this table to analyze what is happening to the Real Estate prices in the 0 - $800,000 Market in the Snow Summit Area. The table and graph have the parameters of: Price Range 0 - $800,000, from October 2020 to September of 2022.
While there will be fluctuations from quarter to quarter but for now the Snow Summit Area has a $27,000 gain over the last 2 years. . I would expect this gain to decrease over the next few quarters. The Snow Summit Area lost $37,000 in average price in the third quarter, and a total of $128,000 from the peak of March 2022. Most of the gain was in our Boom cycle which for most areas stopped in April of 2022.. This loss will now continue to go up because we are in a down cycle. We will have to see how long this down cycle will last and the influence it has on prices.
If you want to know what your Big Bear cabin is worth in this price range, contact me to get a more detailed market analysis that takes into consideration the number of Bedrooms, Bathrooms, Square Feet, Lot size, Condition and Views or location.

Sales vs Active Listings (supply and demand)
Table 2 shows what residential real estate inventory changes (Sales vs Active listings) have occurred for the Total Big Bear Area. It is made up of monthly graphs for each area. Graph 2 below is for the Snow Summit Area. These stats are compiled using a parameter of: Price Range of 0 - $800,000 from the 2-year period October 2020 to September of 2022.
You can see from the last 2 columns that sales have gone up by 7 this quarter compared to last quarter, and listings are down by 6. When you look at this quarter compared to the third quarter of last year, sales are the same in this quarter and listings are up by 8. This shows us that economic influences of higher rates and inflation have not affected sales this quarter compared to last quarter or compared to a year ago. More listings will also cause prices to go down. But listings are down this quarter. Given the current economic conditions I would expect the number of listings to go up and sales to decline. This will put pressure on prices to continue to go down. Which is what you would expect in a declining market. So far the Snow Summit Area is doing well considering the market we are experiencing.


Graph 3 In the Snow Summit area, the sales to expired ratios are still good with sales and expired listings close to a 1:1 ratio and some months has sales much higher. There will always be expired listings. And a 1:1 ratio is considered a good ratio for a stable market. This is another good sign for the Snow Summit area.

Summary
With these numbers we can say that the third quarter continued with prices going down in the Snow Summit Area. The average monthly price is almost the same as two years ago. Also this area had an increase in sales over last quarter even with the declining economy and an decrease in listings. Hopefully this will slow down the decline in prices. It also has still retained equity over the last two years. This quarter we had our first sub area that actually had a loss. That was the Lake Front area with a loss of $22,000 from October 2020. For vacation homes the Snow Summit Area is in a good market. We now know that we are going to stay in this declining market for at least the next few quarters. .It will be interesting to see what happens in the Snow Summit Area.
Expect changes in the graphs for the fourth quarter to better reflect the economy.
My opinion is that we are going to see prices starting to fall. Cabins will be on the market longer. Sales will decline. It will take longer to sell cabins and we will have more expired listings because of the sellers who don’t reduce their price.
Snow Summit Area Market Trends: $800,000 and Up Price Range
The following stats are for the Moonridge Area. I have divided the Total Big Bear Area into 10 Sub Areas also to give you more detailed information on the area where your property is located. Like most of Big Bear, I have broken up the Moonridge Market into two segments Up to $800,000 property value and the Luxury Market over $800,000. This seems to be the most accurate price range to split the market. Every three months, I will post detailed quarterly market trend tables and graphs for each price range with a condensed but easy to understand examinations of the market stats. If you want to just get the short version you can skip to the bottom and read the Summary.
Market Prices
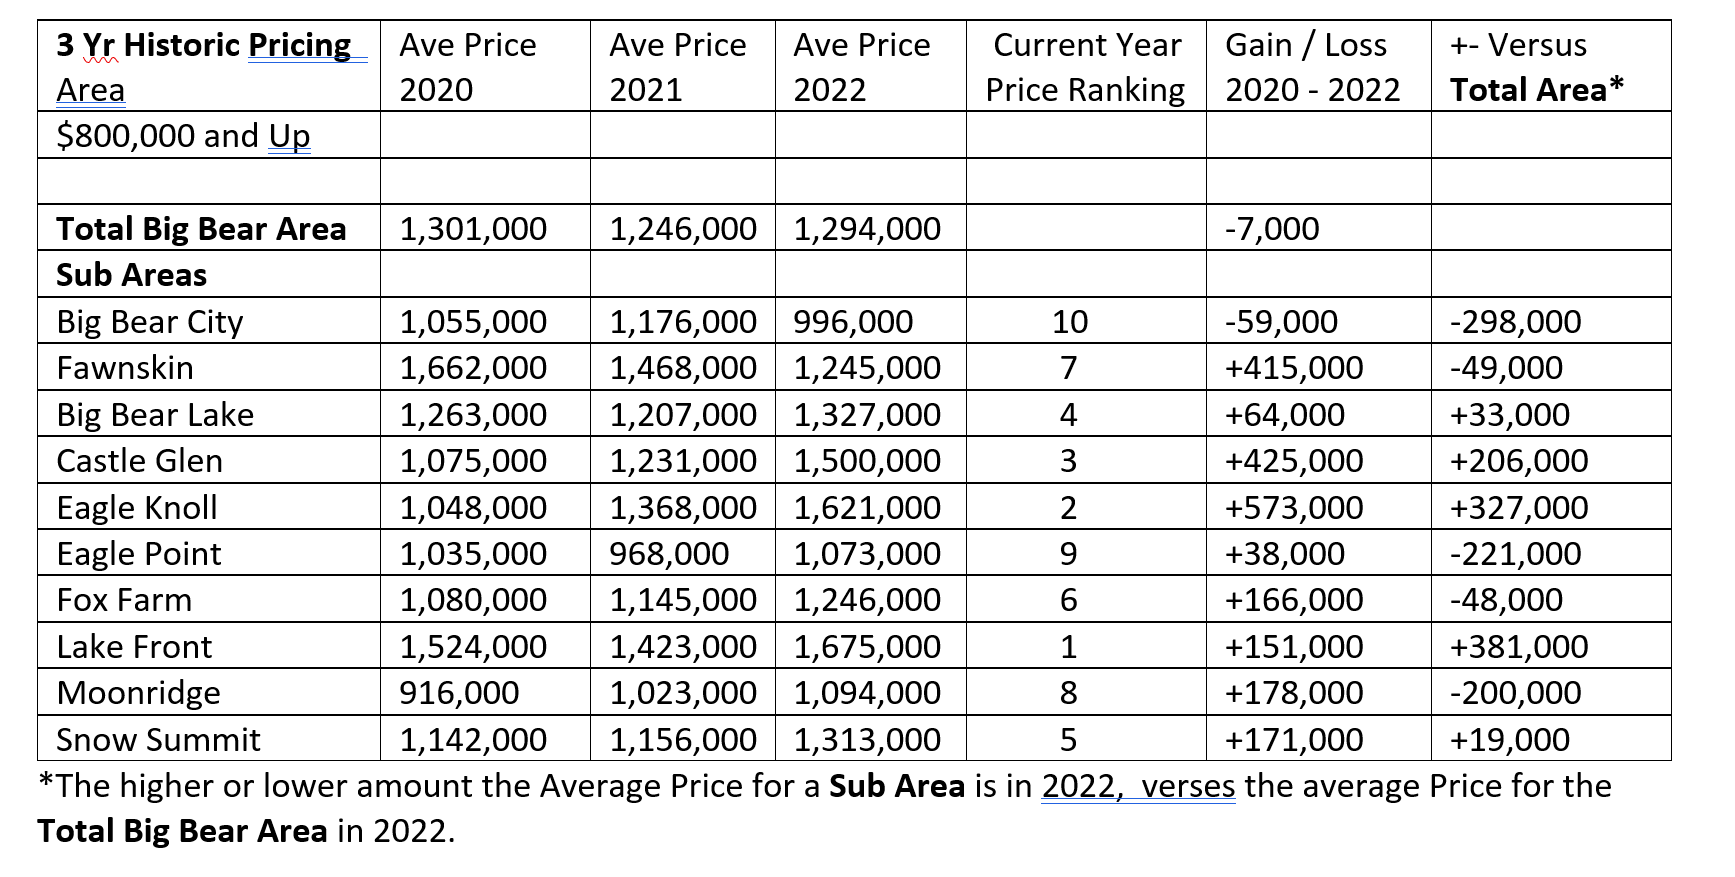
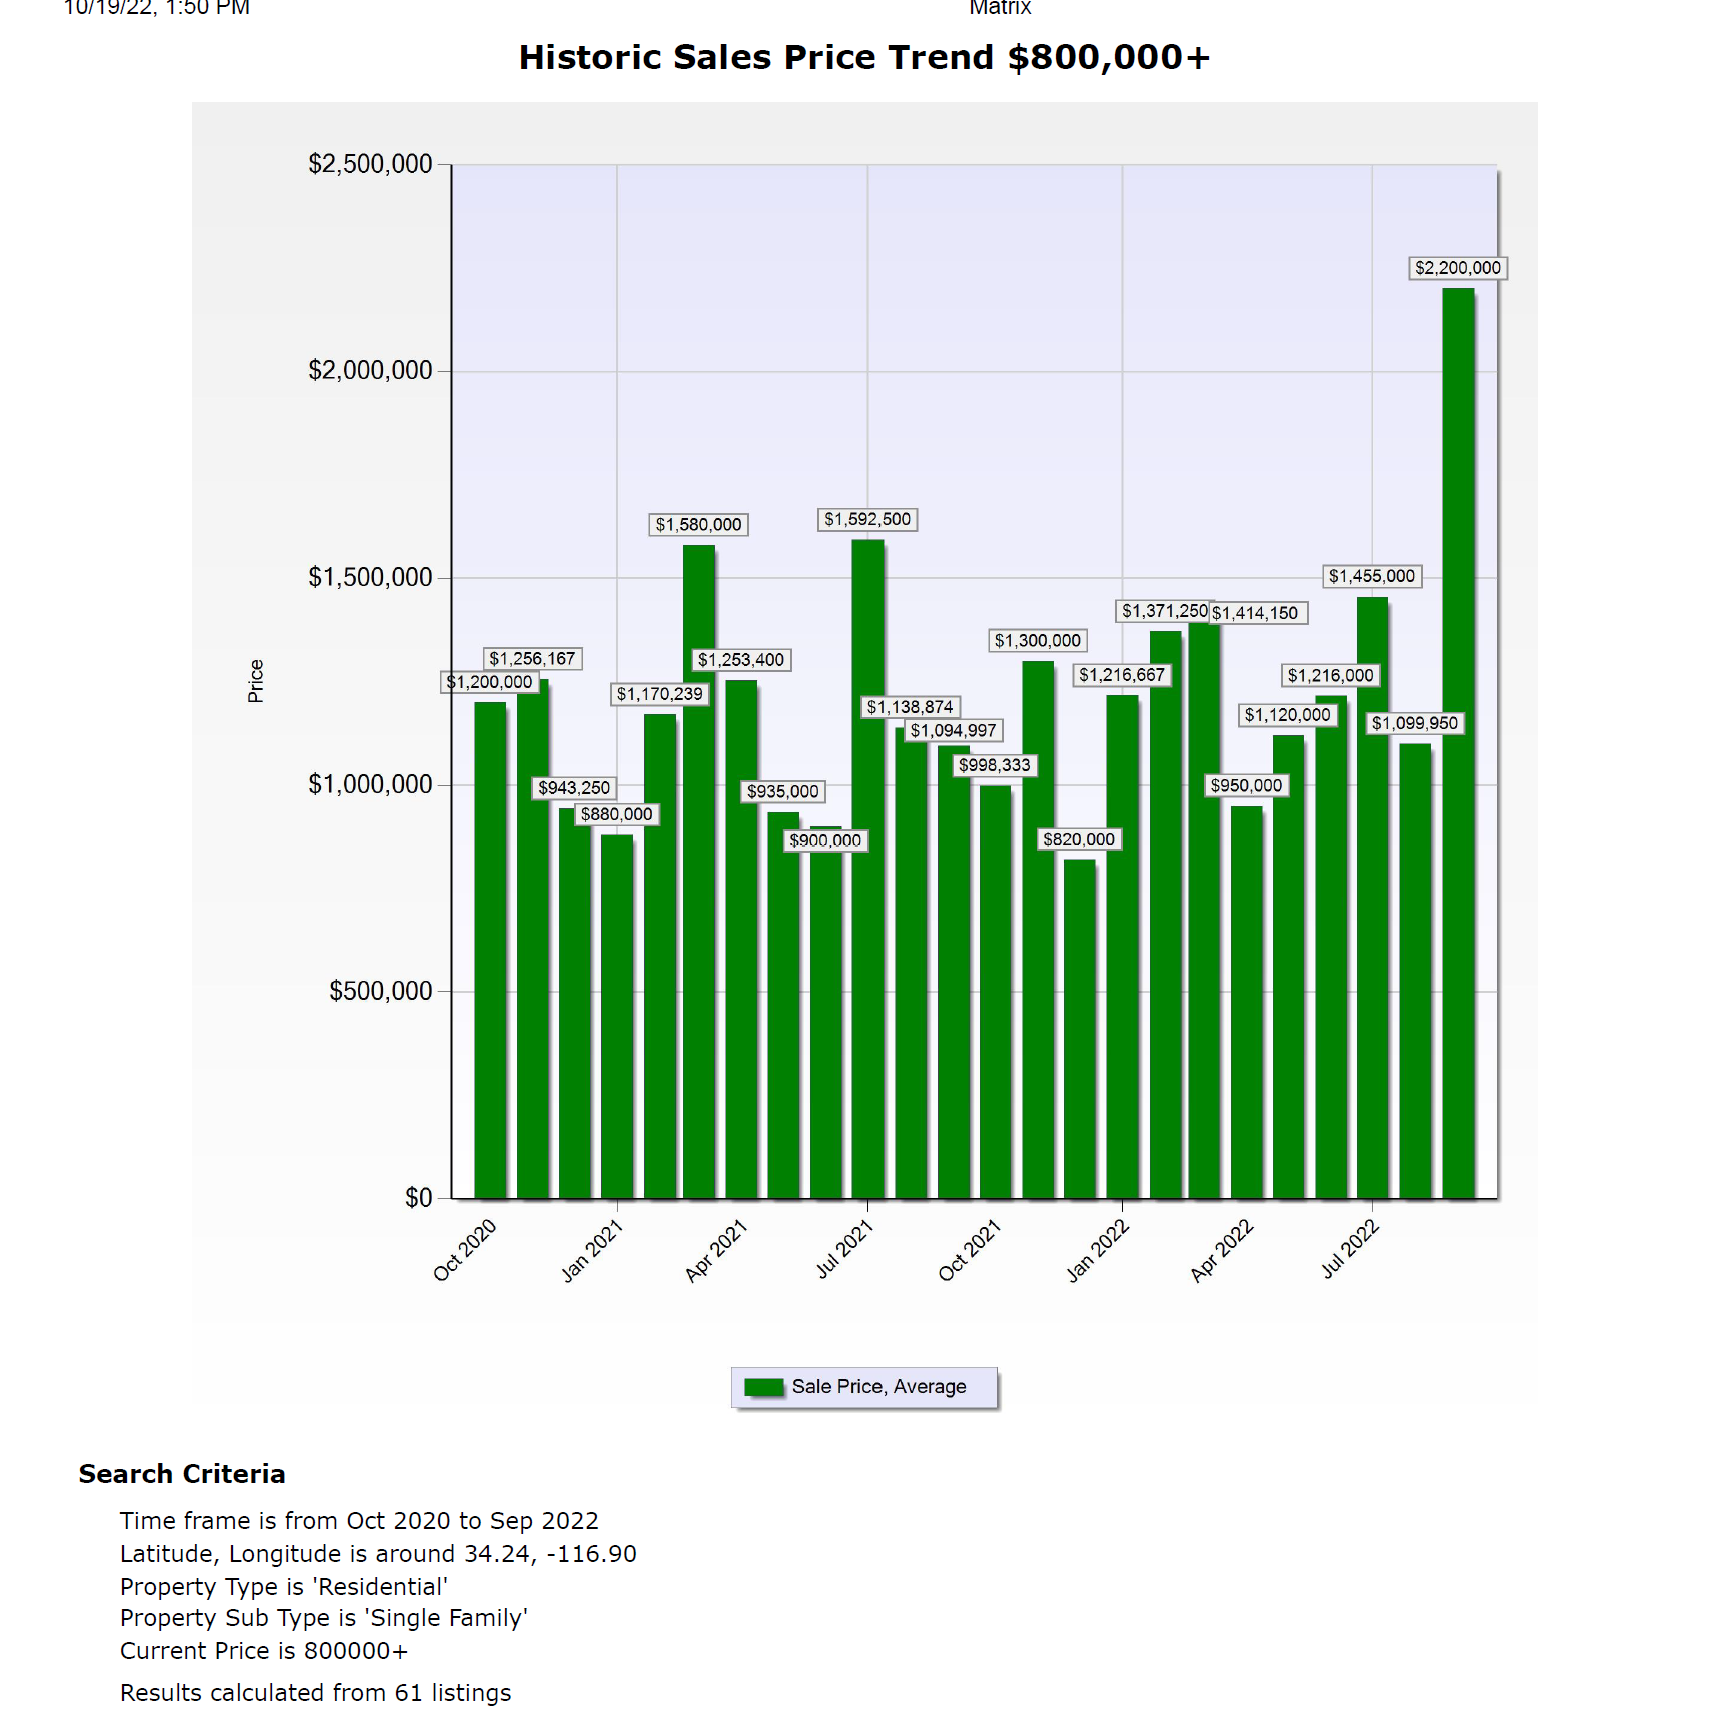
Table 1 (below) was created from the three year average price annual graphs for the Total Big Bear Area and the 10 sub areas from October 2020 to September 2022. Graph 1 below covers the Snow Summit Area. I will be using this table to analyze what is happening to the Real Estate prices in the 0 - $800,000 Market in these areas. The table and graph have the parameters of: Price Range 0 - $800,000, from October 2020 to September of 2022. Because of the volatility of the monthly numbers, which can have a difference of $400,000 or more each month, I will be using the annual averages for the $800,000 and up Luxury market to analyze how prices are changing in this price range. I have also printed the monthly graph (Graph 2) for the Snow Summit Area if you want to look at it.
In the Snow Summit Area, so far in 2022 this area has continued with the price increase that it has been enjoying the last 3 years. What started out with an average price in 2020, of $1,143,000 brought us to $1,313,000 through the first three quarters of 2022. For an increase of $171,000. And the Snow Summit Area has a $19,000 increase over the Total Big Bear Area. This has brought the Snow Summit Area to a ranking of 5 out of 10 areas in average price for 2022 so far. So overall you can see that the prices in the Luxury Market for the Snow Summit Area have had a nice increase the last few years, and is doing better than the Total Big Bear Area and half of the sub areas. But you have to remember that up until a few years ago we really didn’t have many sales in the Snow Summit Area that were $1,000,000 plus. To see how the prices in the other sub areas have done for comparison please refer to Table 1 below or check out the write up on that area.
If you want to know what your Big Bear cabin is worth in this price range contact me, you have to get a more detailed market analysis that takes into consideration the number of Bedrooms, Bathrooms, Square Feet, Lot size, Condition and Views or location.

Sales vs Active Listings (supply and demand)
Table 2 shows what residential real estate inventory changes (Sales vs Active listings) have occurred for the Total Big Bear Area. It is made up of monthly graphs for each area. Graph 3 below is for the Snow Summit Area. These stats are compiled using a parameter of: Price Range of $800,000 and up from the 2-year period October 2020 to September of 2022.
You can see from the last 2 columns that sales are up this quarter compared to last quarter by 2 and listings are down by 6. When you look at this quarter compared to the third quarter of last year sales are up by 4 in this quarter and listings are down by 16. This shows us that economic influences of higher rates and inflation haven’t affected sales compared to last quarter and the Snow Summit Area actually has more sales in this quarter compared to a year ago. So having less listings this quarter compared to last quarter and a year ago didn’t cause sales to go down. Given the current economic conditions I would expect the number of listings to go up and sales to decline. Which is what you would expect in a declining market. It is also worth noting that during 2019 and before we were lucky to have 2 or 3 sales in three months in this price range for the whole Big Bear market. So overall this market is still in good condition.


Graph 4 In the Snow Summit Area, the sales to expired ratios for the last two years have been good with sales and expired listings between a 1:1 and a 1:2 ratio. There will always be expired listings. And a 1:1 ratio is considered a good ratio for a stable market. If we begin to stay in the 1:2 ratio like we have the last 2 months it will be an indicator that this market will be going into a declining market..

Summary
With these numbers we can say that the third quarter in the Snow Summit Area prices have stayed good which has preserved the equity build up in the cabins there for the last 3 years. Sale have gone up the last quarter and listings have gone down. Which will help prices stay up. Expired listings have stayed about the same but the ratio has gone up for the expired listings this quarter which indicates that this market may be getting weaker. The nice part is that sales and prices stayed at a good level. For vacation homes in a luxury market this is a good market for now. We will have to see how the influence of the economy affect this market.
We now know that we are headed into the possibility of a very different market. Economic data for the fourth quarter and beyond is all pointing to a slowdown in the market.
Expect changes in the graphs for the fourth quarter to better reflect the economy.
My opinion is that we are going to witness a more normal market. In order to get to that normal market prices may come down a little more. Cabins will be on the market a little longer. Sales will decline.
Summary
With these numbers we can say that the first quarter had a significant drop in price. But I’ll say again you have to remember that this price range has wider price swings than the 0 - $800,000 market. By looking at the graphs you can see that we can have a month to month swing of $400,000 or more for different months. The nice part is that sales stayed at a good level. For vacation homes in a luxury market this is a nice market. In the 0-$800,000 market we would compare the big three areas of Big Bear Lake, The Total Big Bear Valley and Big Bear City. But in the luxury market I don’t use Big Bear City because of lack of sales in the $800,000 and up luxury market. So from what I can see the Snow Summit Luxury market is on par with the rest of the areas in Big Bear with steady prices so far.
We now know that we are headed into a very different market. Economic data for the third quarter and beyond is all pointing to a slow down in the market.
My opinion is that we are going to witness a more normal market. In order to get to that normal market prices may come down a little more. Cabins will be on the market a little longer. Sales will decline.