

Q3 Market Report - Under 800k
Total Big Bear Area Market Trends: $0-$800,000 Price Range
The following stats are for the entire Big Bear Area. I have divided the Big Bear Area into 11 Sub Areas also to give you more detailed information on the area where your property is located. Like most of Big Bear, I have broken up the Total Big Bear Market into two segments Up to $800,000 property value and the luxury market over $800,000. This seems to be the most accurate price range to split the market. Every three months, I will post detailed quarterly market trend tables and graphs for each price range with a condensed but easy to understand examinations of the market stats. If you want to just get the short version you can skip to the bottom and read the Summary.
Market Prices
Table 1 (below) was created from the two year average price monthly graph from October 2020 to September 2022 (See Graph 1), This graph covers the Total Big Bear Area that consist of the ten Sub Areas I have reported on. I will be using this table to analyze what is happening to the Real Estate prices in the 0 - $800,000 Market in the Big Bear Area. The table and graph have the parameters of: Price Range 0 - $800,000, from October 2020 to September of 2022.
While there will be fluctuations from quarter to quarter The Total Big Bear Valley still has a $51,000 gain over the last 2 years. But I would expect this gain to be lowered over the next few quarters. We lost $36,000 in the third quarter. Most of the gain was in our Boom cycle. This gain will now continue to go down because we are in a down cycle. We will have to see how long this down cycle will last and how far prices will go down. To see how the prices in the sub areas have done please refer to Table 1 below or check out the write up on that area.
If you want to know what your Big Bear cabin is worth in this price range, you have to get a more detailed market analysis that takes into consideration the number of Bedrooms, Bathrooms, Square Feet, Lot size, Condition and Views or location.


Sales vs Active Listings (supply and demand)
Table 2 shows what residential real estate inventory changes (Sales vs Active listings) have occurred for the Total Big Bear Valley Area on a monthly basis. These stats are compiled from Graph 2 using a parameter of: Price Range of 0 - $800,000 from the 2-year period October 2020 to September of 2022.
You can see from the last 2 columns that sales are down this quarter compared to last quarter by 28 and listings are up by 269. But when you look at this quarter compared to the third quarter of last year sales are down by 170 in this quarter and listings are up by 87. This shows us that economic influences of higher rates and inflation are causing sales to go down which causes more listings on the market. More listings also causes the prices to go down as we saw in the pricing section. Given the current economic conditions I would expect the number of listings to go up and sales to continue to decline. This will also put pressure on prices to go down. Which is what you would expect in a declining market. It will be interesting to see if the pressure of so many listings continues to drive the average price down.


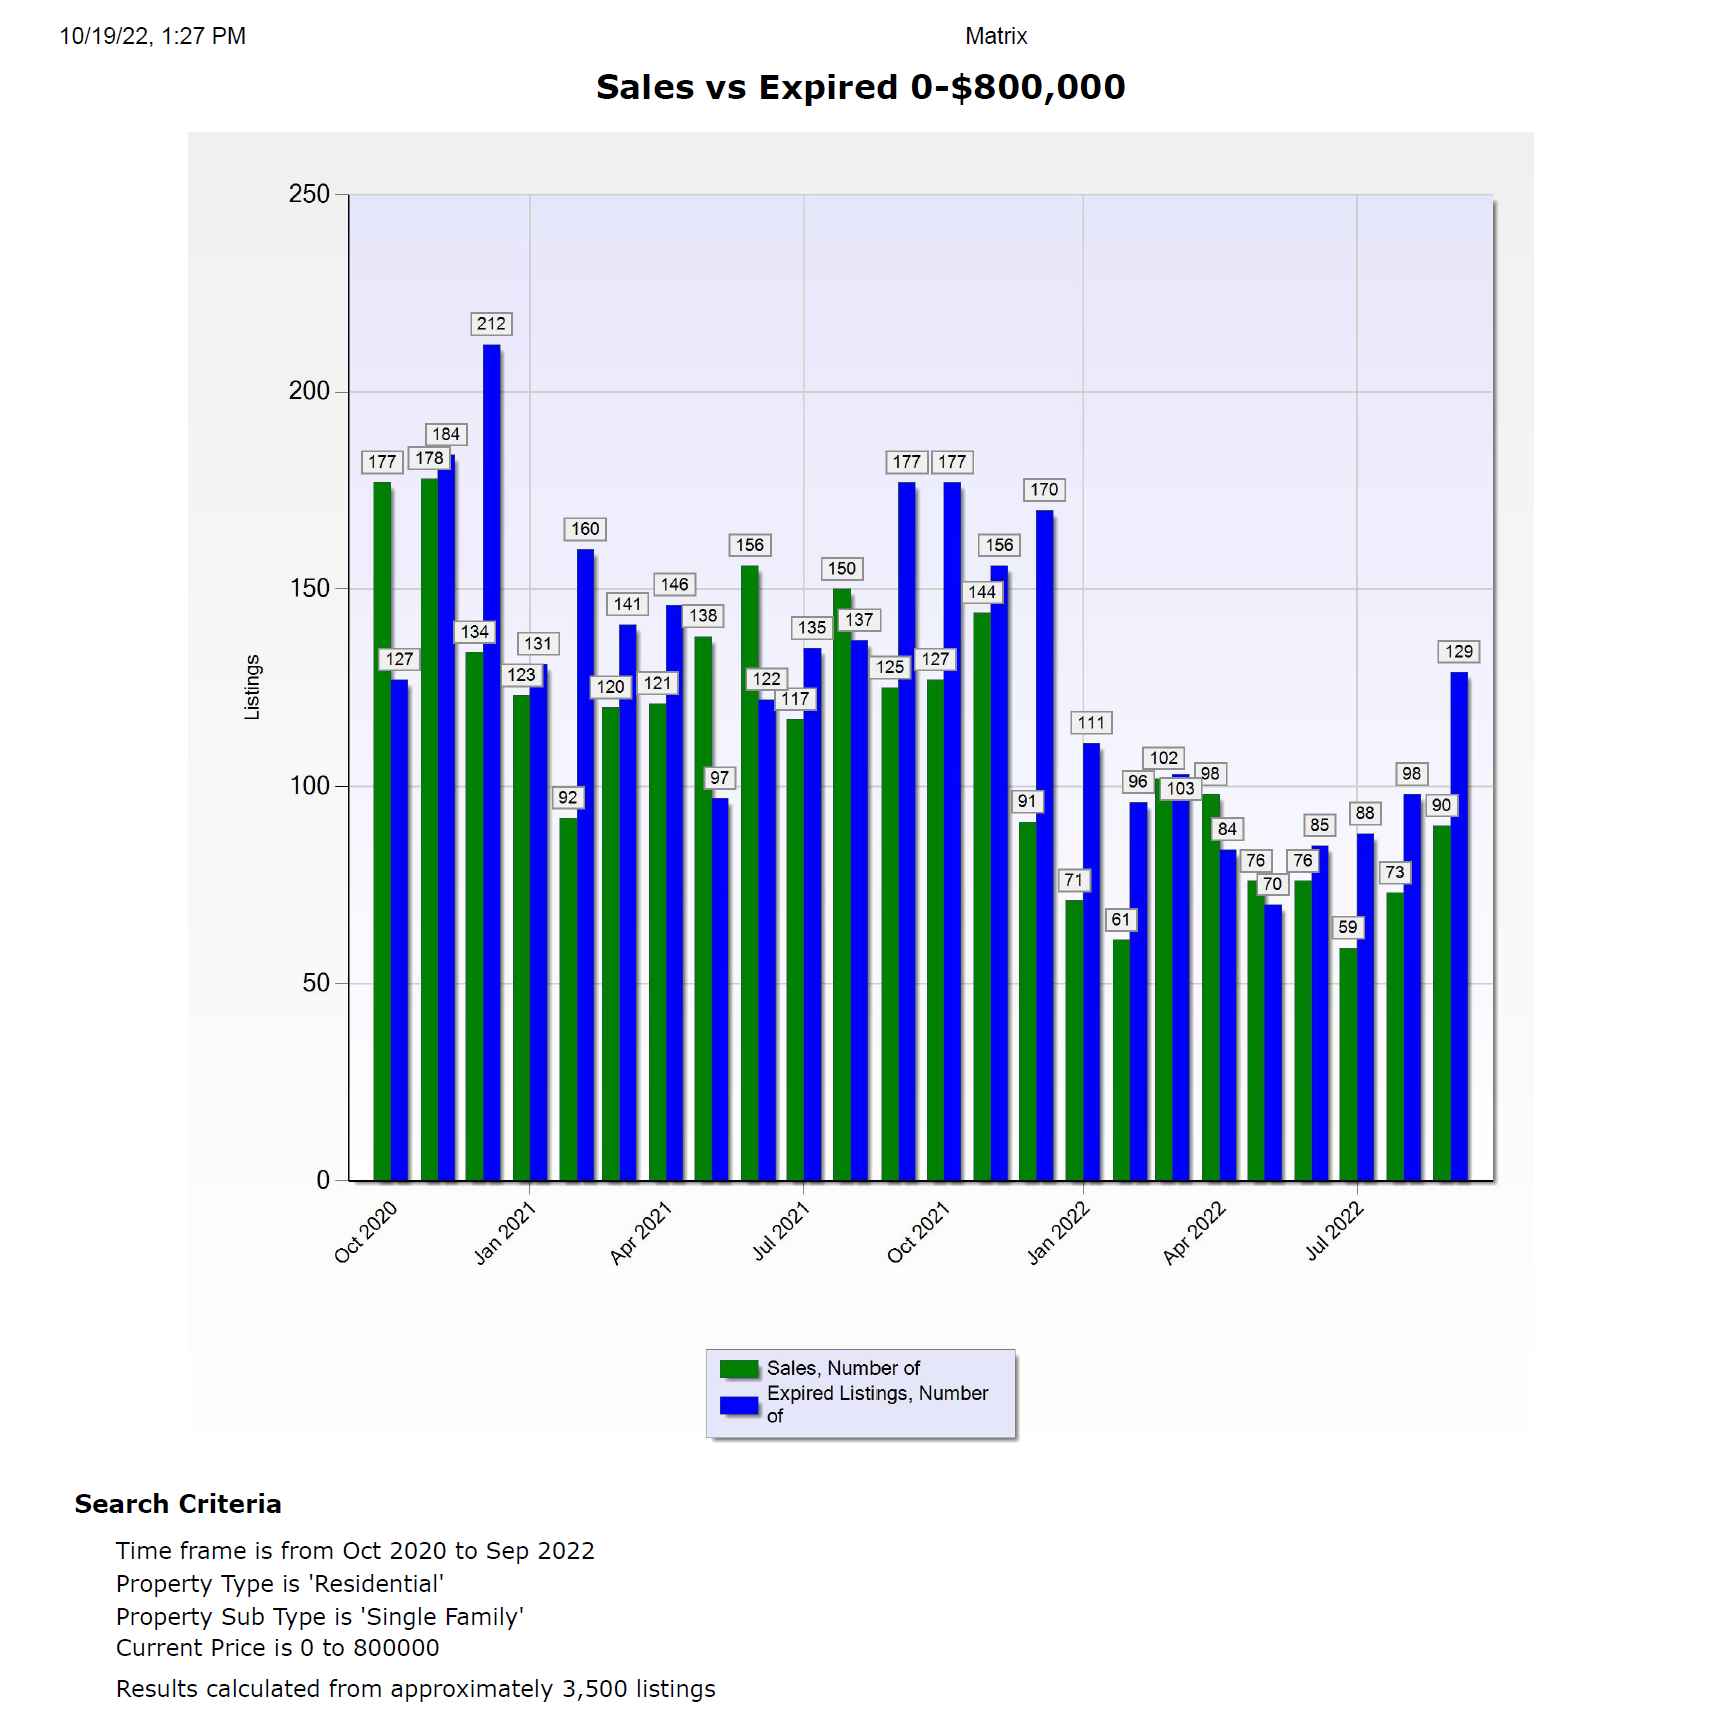
Sales vs Expired Listings (strength of Sales)
Graph 3 In the Total Big Bear Area, the sales to expired ratios have been at a good level. With sales and expired listings close to a 1:1 ratio. There will always be expired listings. And a 1:1 ratio is considered a good ratio for a stable market. But in the last quarter we are seeing more expired listings which is getting us closer to a 1:2 ratio of sales to expired listings. Which is considered a declining market. This will probably continue for the next few quarters.
Summary
With these numbers we can say that the third quarter continued with a large drop in price. But still had prices that were higher than 2 yeas ago. So we still had gain in the equity of cabins that were purchased at least 2 years ago. This was also true for all the sub areas but one. This quarter we had our first sub area that actually had a loss. That was the Lake Front area with a loss of $22,000 from 10/2020. The nice part is that sales while declining stayed at a good level. For vacation homes we are in a declining market. We now know that we are going to stay in this declining market for at least the next few quarters. .
Expect changes in the graphs for the fourth quarter to better reflect the economy.
My opinion is that we are going to see prices continue to fall. Cabins will be on the market a longer. Sales will decline. It will take longer to sell cabins and we will have more expired listings because of the sellers who don’t reduce their price.