

Q4 Market Report - Big Bear Lake
Big Bear Lake Area Market Trends: $0-$800,000 Price Range
The following stats are for the Big Bear Lake Area. I have divided the Total Big Bear Area into 10 Sub Areas to give you more detailed information on the area where your property is located. Like most of Big Bear, I have broken up the Big Bear Lake Market into two segments Up to $800,000 property value and the Luxury Market over $800,000. This seems to be the most accurate price range to split the market. Every three months, I will post detailed quarterly market trend tables and graphs for each price range with a condensed but easy to understand examination of the market stats. If you want to just get the short version of the market in the Big Bear Lake area you can skip to the bottom of each price range and read the Summary.
Market Prices
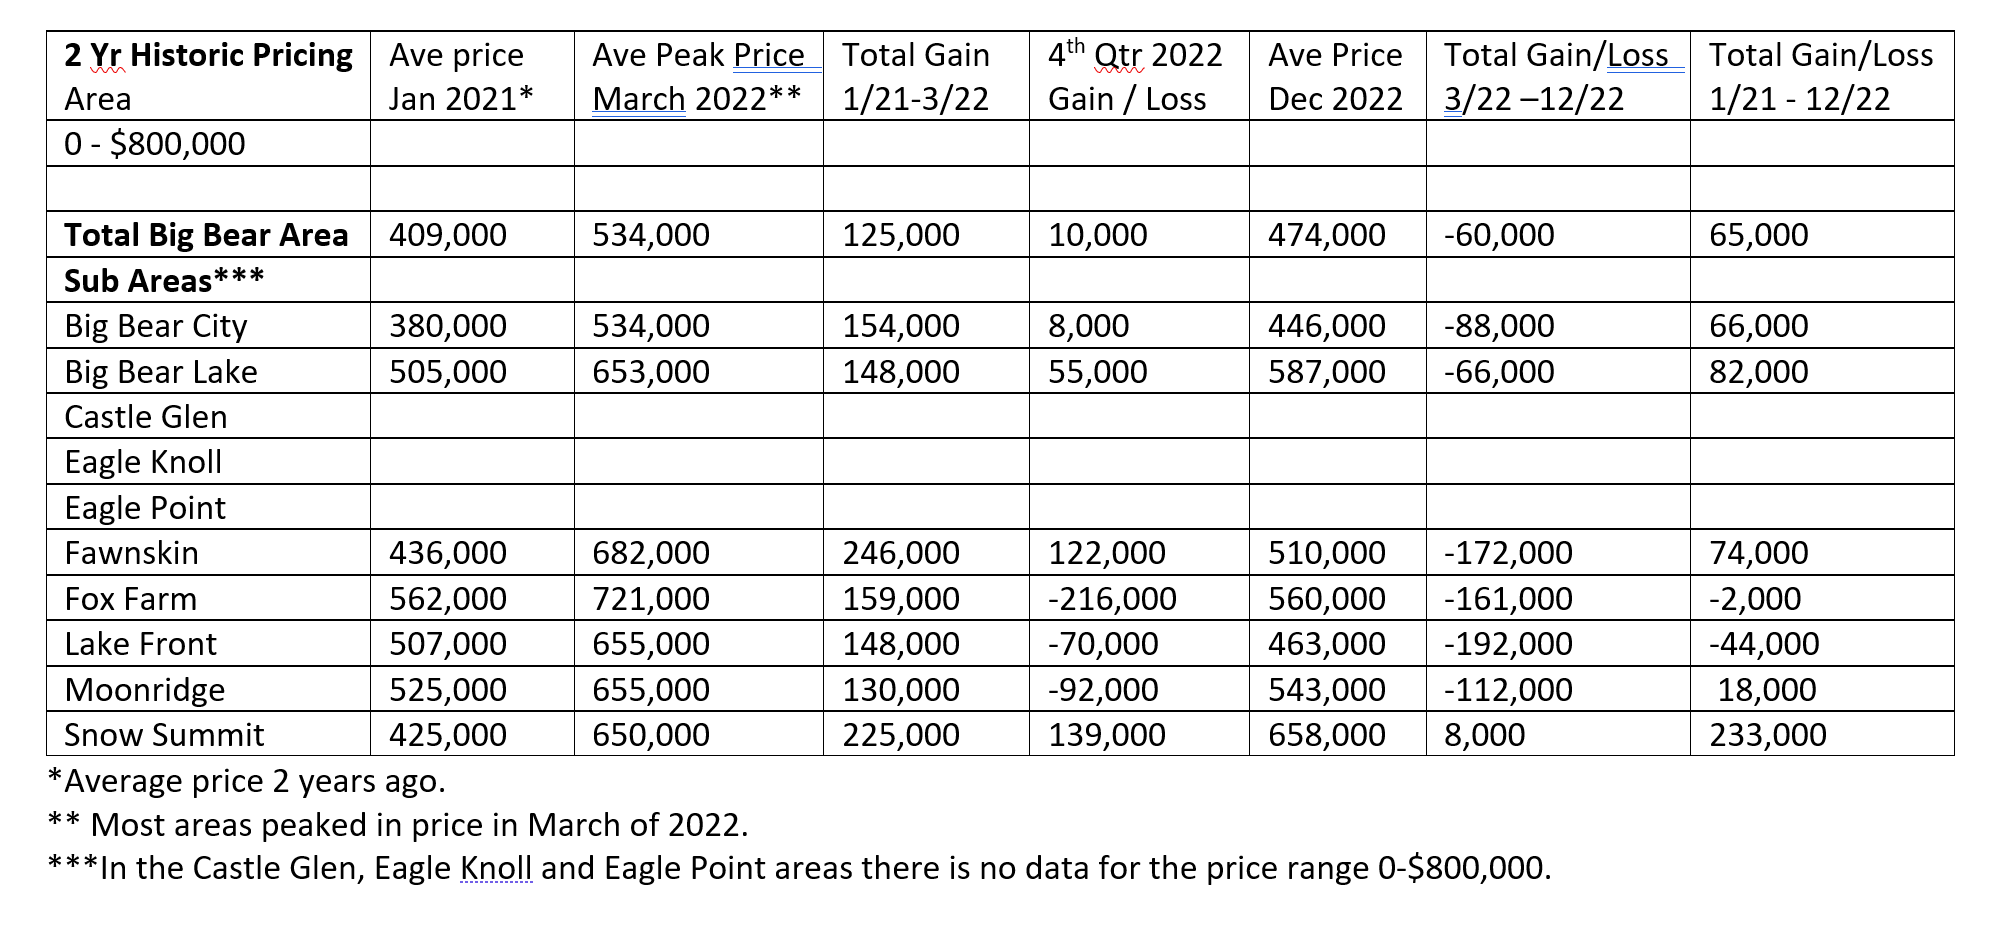
Table 1 (below) was created from the two year average price monthly graphs for the Total Big Bear Area and the 10 sub areas. Graph 1 below covers the Big Bear Lake Area monthly stats. I will be using the table to analyze what trends I see with Real Estate prices in the 0 - $800,000 Market in the Big Bear Lake Area. The table and graph have the parameters of: Price Range 0 - $800,000, from January 2021 to December of 2022.
There will be fluctuations from quarter to quarter but for now The Big Bear Lake Area has a $82,000 gain over the last 2 years. But I would expect this gain to be lowered over the next few quarters. The Big Bear Lake Area gained $55,000 in average price in the fourth quarter. But has lost a total of $66,000 from the peak of March 2022. Most of the gain was in our Boom cycle which for most areas stopped in April of 2022.. This gain will now continue to go down because we are in a down cycle. We will have to see how long this down cycle will last and the influence it has on prices.
If you want to know what your Big Bear cabin is worth in this price range in the Big Bear Lake area, contact me to get a more detailed market analysis that takes into consideration the number of Bedrooms, Bathrooms, Square Feet, Lot size, Condition and Views or location.

Sales vs Active Listings (supply and demand)
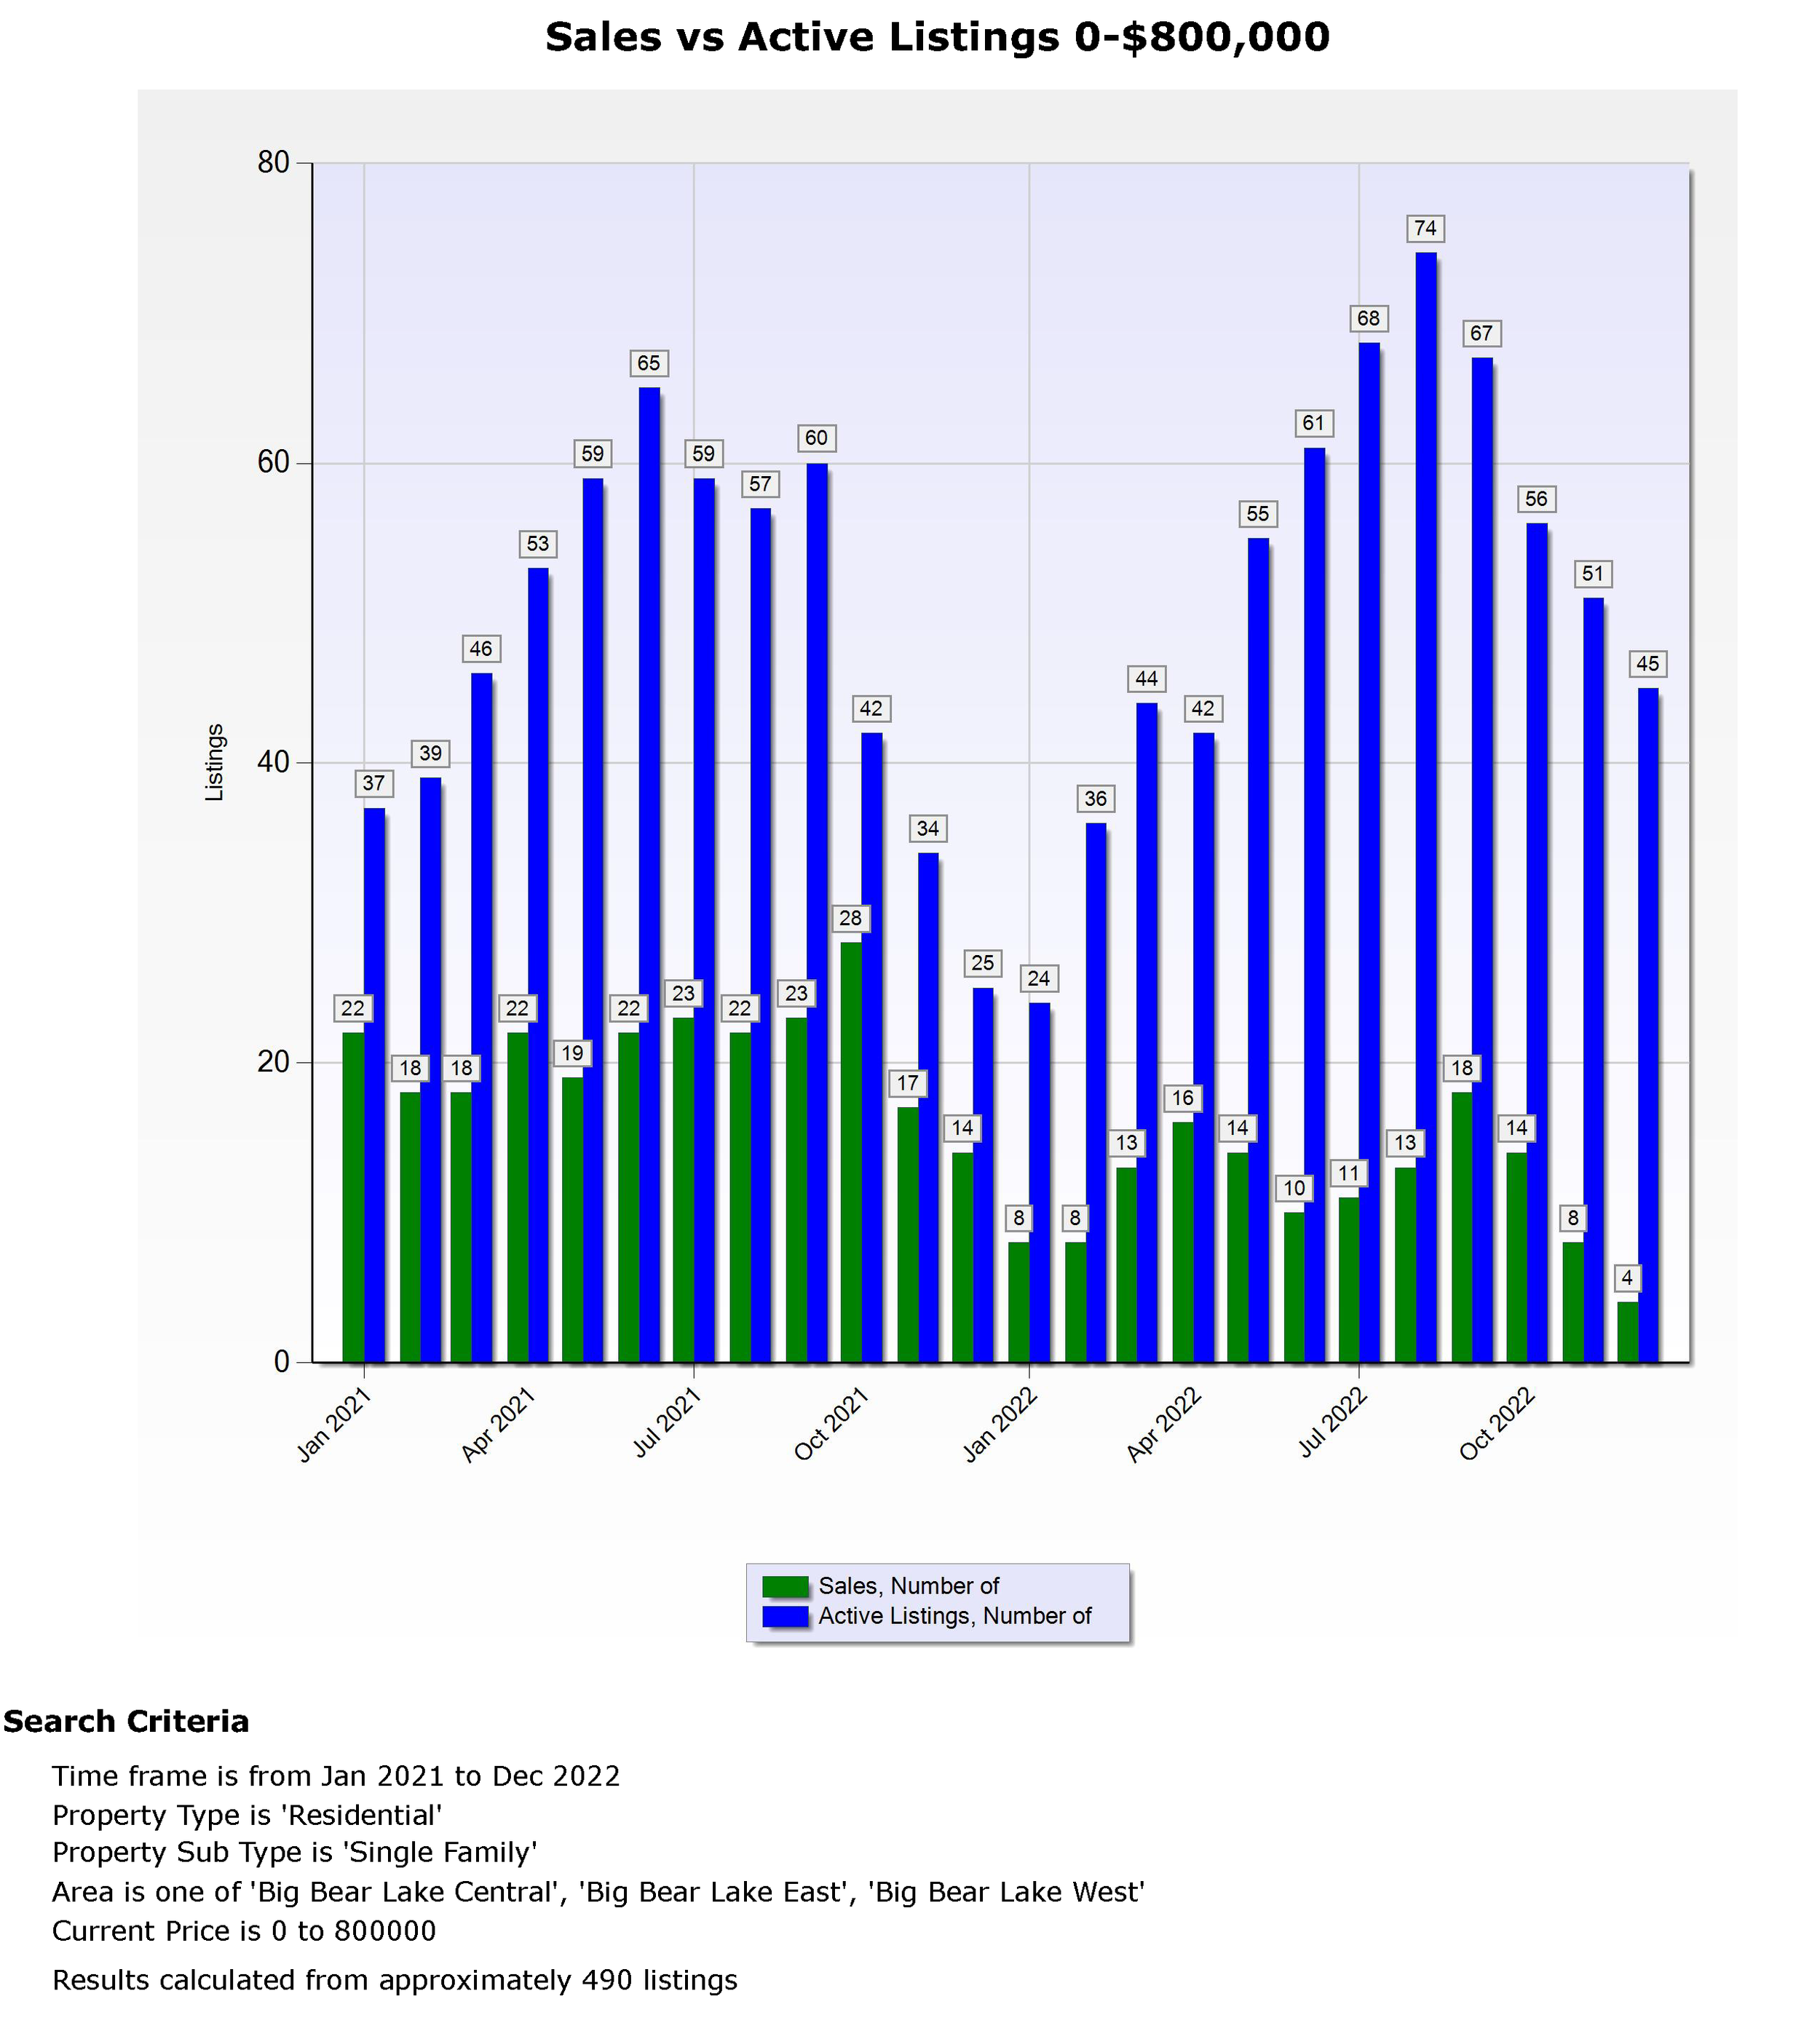
Table 2 shows what residential real estate inventory changes (Sales vs Active listings) have occurred for the Total Big Bear Area and sub areas. It is made up of monthly graphs for each area. Graph 2 below is for the Big Bear Lake Area monthly stats. These stats are compiled by using a parameter of: Price Range of 0 - $800,000 from the 2-year period January 2021 to December of 2022.
You can see from column 5 that sales have dropped by 14 this quarter compared to last quarter, and listings are also down by 22. When you look at this quarter compared to the fourth quarter of last year, column 6, sales are down by 10 in this quarter and listings are up by 20. This shows us that economic influences of higher rates and inflation and a higher amount of listings have affected sales to go down compared to last quarter and this quarter compared to the fourth quarter of last year. Given the current economic conditions I would expect to see a continuation of the number of listings to go up and sales to decline. This will also put pressure on prices to continue to go down. Which is what you would expect in a declining market.

Sales vs Expired Listings (strength of Sales)
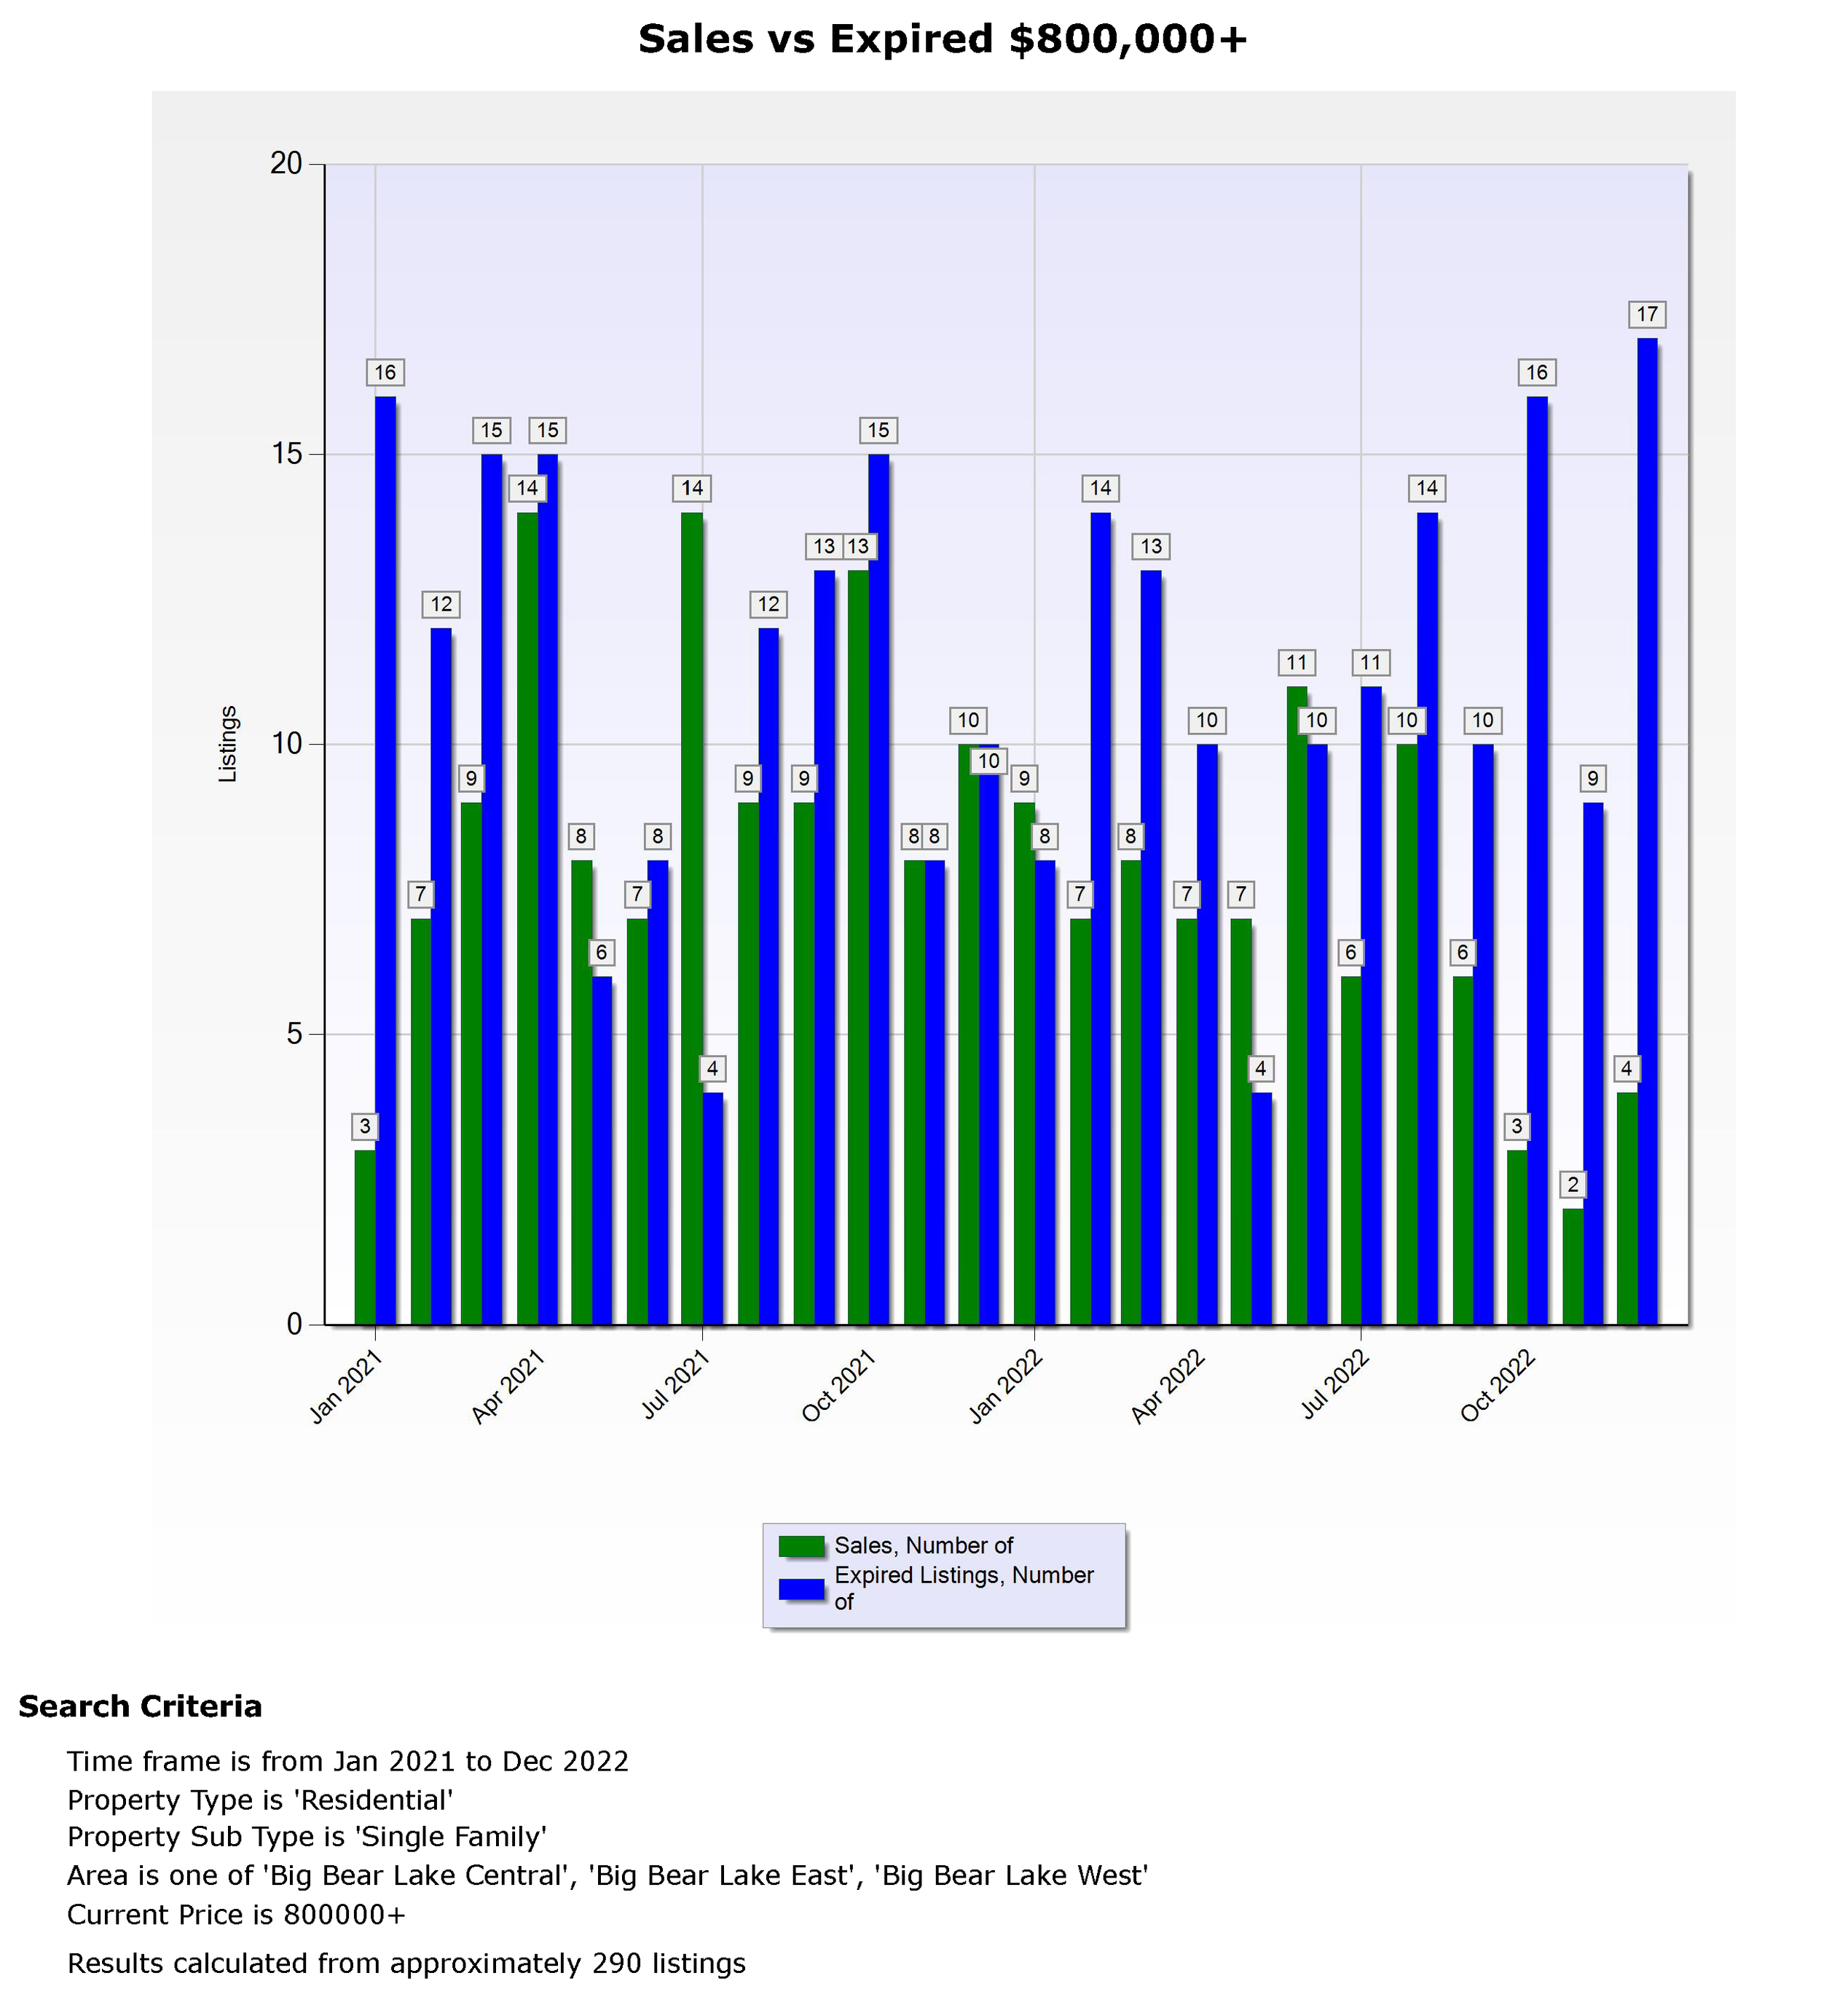
Graph 3 In the Big Bear Lake Area, the sales to expired ratios have been at a good level the last two years. With sales and expired listings close to a 1:1 ratio. There will always be expired listings. And a 1:1 ratio is considered a good ratio for a stable market. But in the last quarter we are seeing expired listings creep up to a 1:2 ratio (or more) of sales to expired listings which shows we are in a declining market that should drive prices down.

Summary
With these numbers we can say that the fourth quarter had a surprising increase in average price of $55,000. So we still have a gain in the equity of cabins that were purchased at least 2 years ago on average of $82,000 in this price range. The bad news with the Big Bear Lake Area is that sales had a trend down this quarter with listings going up. Which puts pressure on prices to go down. This is what you would expect in a declining market. We now know that we are going to stay in this declining market for at least the next few quarters.
Economic data for the fourth quarter and beyond is all pointing to a continuation of a down market.
Expect the graphs for the first quarter of 2023 to reflect a continued slow Real Estate Market.
My opinion is that we are going to see prices continue to fall. Cabins will be on the market longer. Sales will decline. It will take longer to sell cabins and we will have more expired listings because of the sellers who don’t reduce their price.
Big Bear Lake Area Market Trends: $800,000 and Up Price Range
The following stats are for the Big Bear Lake Area. I have divided the Total Big Bear Area into 10 Sub Areas to give you more detailed information on the area where your property is located. Like most of Big Bear, I have broken up the Big Bear Lake Market into two segments Up to $800,000 property value and the Luxury Market over $800,000. This seems to be the most accurate price range to split the market. Every three months, I will post detailed quarterly market trend tables and graphs for each price range with a condensed but easy to understand examination of the market stats. If you want to just get the short version you can skip to the bottom and read the Summary.
Market Prices
Because of the volatility of the monthly numbers in this price range, which can have a difference of $400,000 or more each month, unlike the 0-$800,000 price range I will be using the annual averages for the $800,000 and up Luxury market to analyze how prices are trending in this price range.
Table 1 (below) was created from the last three years, average annual price graph (graph 1) for the Total Big Bear Area and the 10 sub areas. I will be using this table to analyze what trends I see with Real Estate prices in the $800,000 and up Market in these areas. The table and graph have the parameters of: Price Range $800,000 and up, from January 2020 to December of 2022. I have also printed the monthly graph (Graph 2) for the Big Bear Lake Area if you want to look at it.
The Big Bear Lake Area Luxury market in 2022 has continued with a steady price of around $1,466,000 for the last 3 years. What started out with an average price in 2020, of $1,465,000 brought us to $1,467,000 through 2022. For an increase of $2,000. And the Big Bear Lake Area has a $187,000 higher increase over the Total Big Bear Area. These two increases have brought the Big Bear Lake Area to a ranking of 4 out of 10 areas in average price for 2022. So overall you can see that the Big Bear Lake Area is doing much better than the Total Big Bear Area and most of the sub areas overall. To see how the prices in the other sub areas have done for comparison please refer to Table 1 below or check out the write up on that area.
If you want to know what your Big Bear cabin is worth in this price range in the Big Bear Lake area, contact me to get a more detailed market analysis that takes into consideration the number of Bedrooms, Bathrooms, Square Feet, Lot size, Condition and Views or location.


Sales vs Active Listings (supply and demand)
Table 2 shows what residential real estate inventory changes (Sales vs Active listings) have occurred for the Total Big Bear Area. It is made up of monthly graphs for each area. Graph 3 below is for the Big Bear Lake Area. These stats are compiled using a parameter of: Price Range of $800,000 and up from the 2-year period October 2020 to September of 2022.
You can see from column 5 that sales are down this quarter compared to last quarter by 2 and listings are up by 1. When you look at the fourth quarter of 2022 compared to the fourth quarter of last year column 6 sales are down by 6 in this quarter and listings are up by 21. This shows us that economic influences of higher rates and inflation are causing sales to go down which causes more listings on the market. The more listings also cause the prices to go down. But so far prices have held steady for this market. Given the current economic conditions I would expect the number of listings to go up and sales to continue to decline. It is also worth noting that during 2019 and before we were lucky to have 2 or 3 sales in three months in this price range for the whole Big Bear market. So overall this market is declining but I don’t think unless we have a major financial meltdown we will get back to 2019 levels.


Graph 4 In the Big Bear Lake Area, the sales to expired ratios are still good with sales and expired listings close to a 1:1 ratio. There will always be expired listings. And a 1:1 ratio is considered a good ratio for a stable market. But now in the last 2 quarters we are seeing 1:2 ratio up to a 1:4 ratio. Which is another indicator that we are in a declining market. Hopefully this won’t get much worse over the next few quarters.
Summary
With these numbers we can say that the fourth quarter in the Big Bear Lake Area still has a small increase in prices that has preserved it’s average price to $187,000 over the Total Big Bear Area average for this price range. Sales have dropped and listings and expired listings have started to go up. The nice part is that sales stayed at a good level compared to 2019 and before. For vacation homes in a luxury market this is a declining market for now. We will have to see how the influence of increased listings and expired listings affect this market.
Economic data for the fourth quarter and beyond is all pointing to a continuation of a down market.
Expect the graphs for the first quarter of 2023 to reflect a continued slow Real Estate Market.
My opinion is that we are going to see prices continue to fall. Cabins will be on the market longer. Sales will decline. It will take longer to sell cabins and we will have more expired listings because of the sellers who don’t reduce their price.