La Mirada Real Estate Market Price Trends Landmark
Due to low sales, next month I will start using a 12-month average instead of a 6-month average. This way, I can give you a better idea of this neighborhood’s price trends.
Twice a month, I will provide you with updates on La Mirada real estate prices and trends.
Report 1 will cover monthly neighborhood prices over the last six months.
Report 2 will cover the current trends of the overall La Mirada real estate market.
Report 1
Landmark Six-Month Price Summary
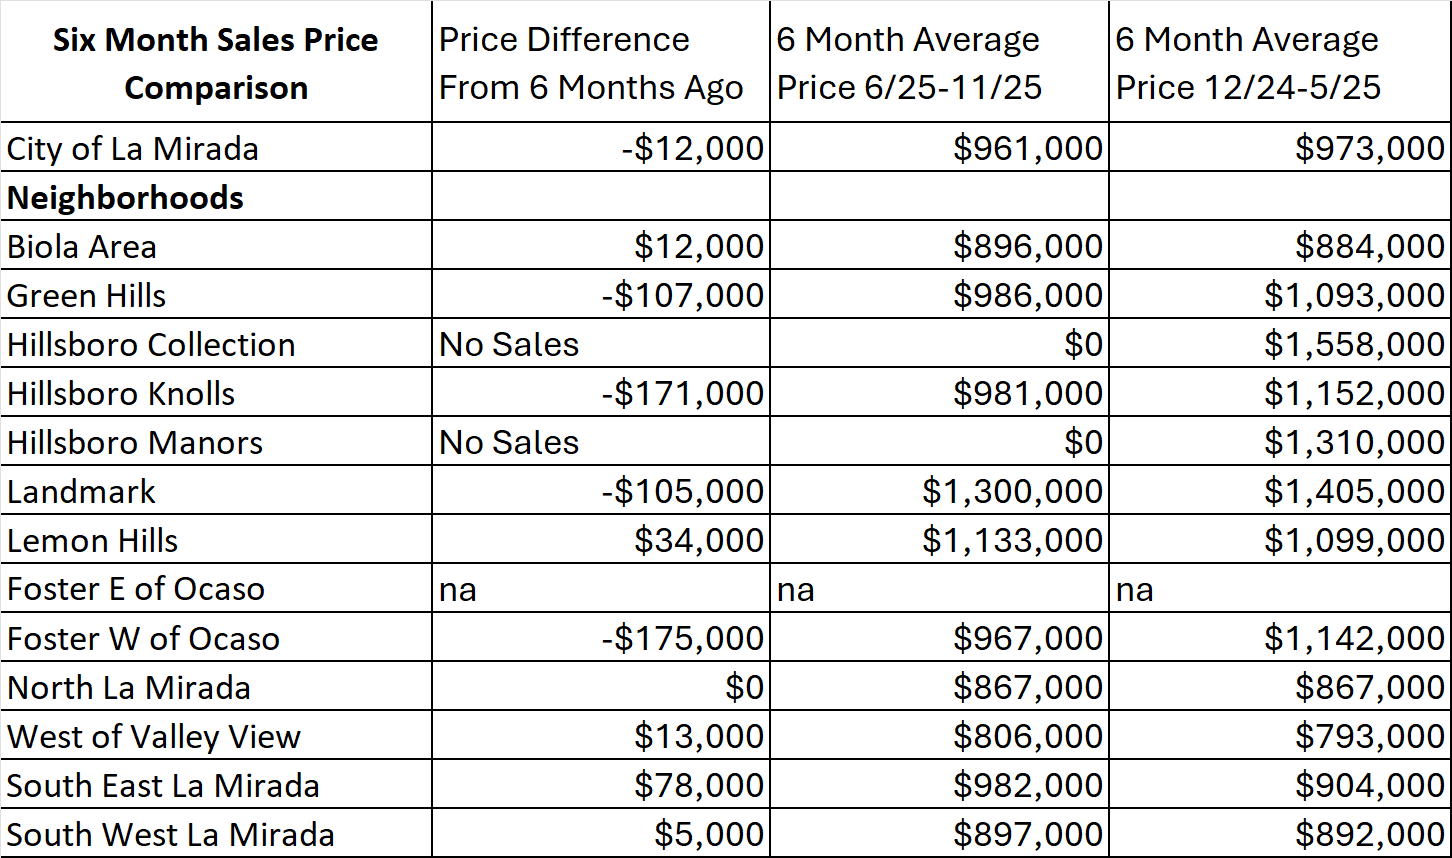
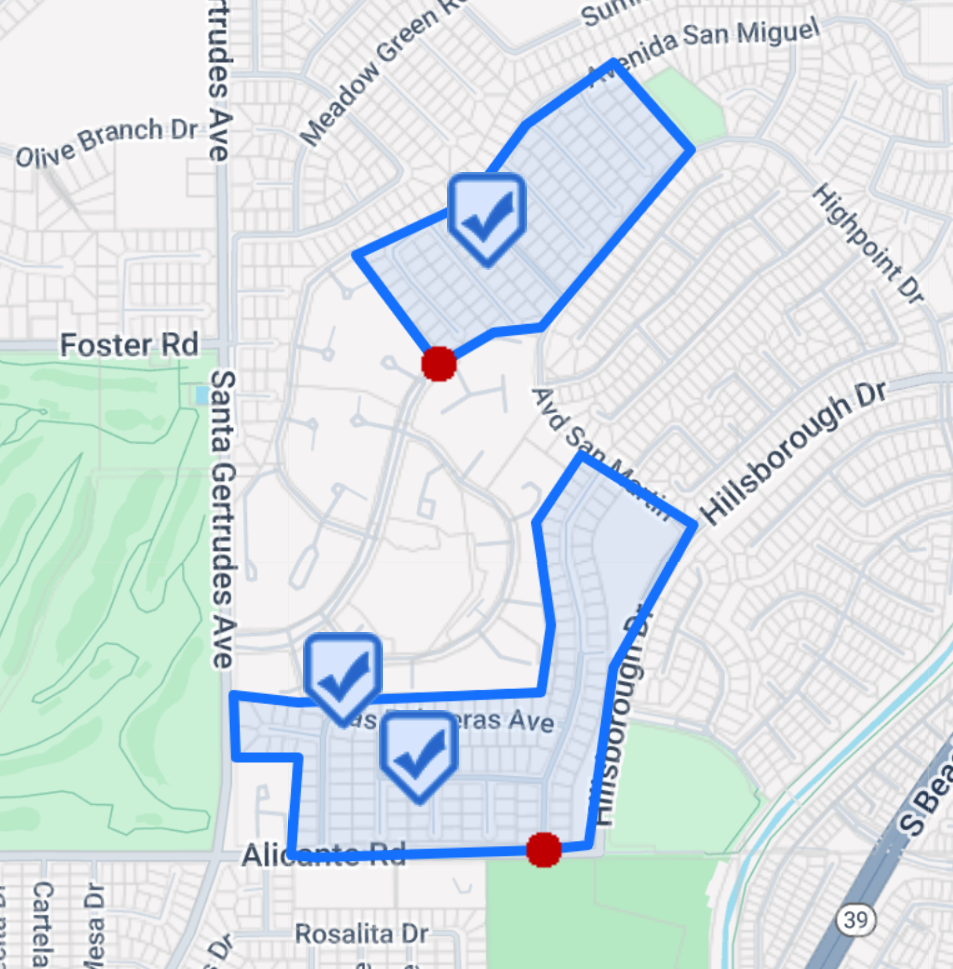
The six-month average price for this neighborhood was $1,300,000, compared with $1,405,000 for the six months before that. This gives Landmark an average monthly price decrease of $105,000 over the last six months. As you can see from the map below, there haven’t been many sales, and several months have gone by without any sales. Overall prices have remained relatively stable over the last six months. The lowest monthly average over the last six months was $1,300,000, and the highest monthly average was $1,300,000.
This was due to only one sale in Landmark in the last 6 months.
With so few houses selling in Landmark, there just isn’t enough data to get accurate statistics. The information here is intended as a guideline. If you need accurate information on your home, contact me.
This neighborhood has averaged 0.2 sales per month over the last six months. Homes are still selling quickly in La Mirada, where the average days to sell a house are 17. Sales in this neighborhood for the last six months have averaged 9 days on the market before entering escrow.
Overall, Landmark is doing very well. The price increase is due to the high demand for this area. Demand for this area has always been strong and is expected to remain so due to the neighborhood's appeal. Most of the homes in this tract have been updated. Making this tract similar to a tract of homes in Orange County, but at better prices than you can get in Orange County.
If you would like to see how Landmark prices compare to the city of La Mirada and the other neighborhoods, you can see this from the section below titled: Landmark comparison to the city of La Mirada and other La Mirada neighborhoods.
If you would like a detailed analysis of your home’s current market value, please call, text, or email me.
I will send you a detailed Market Analysis of your home that will take into account its condition, square footage, improvements, and special features.
Cell 714 342-7270
Email tysutherland@firstteam.com
Let me build a customized home-selling experience to meet your needs
If you are thinking of selling, I will also send you information on our EXCLUSIVE, INDUSTRY-LEADING Buyer Delivery System. Our Approach Generates Motivated Buyers and Drives Demand for Your Home, Resulting in the Quickest Sale at the Highest Price for our Clients.
A map of current active listings and the sales for Landmark for the last six months was used for analysis.
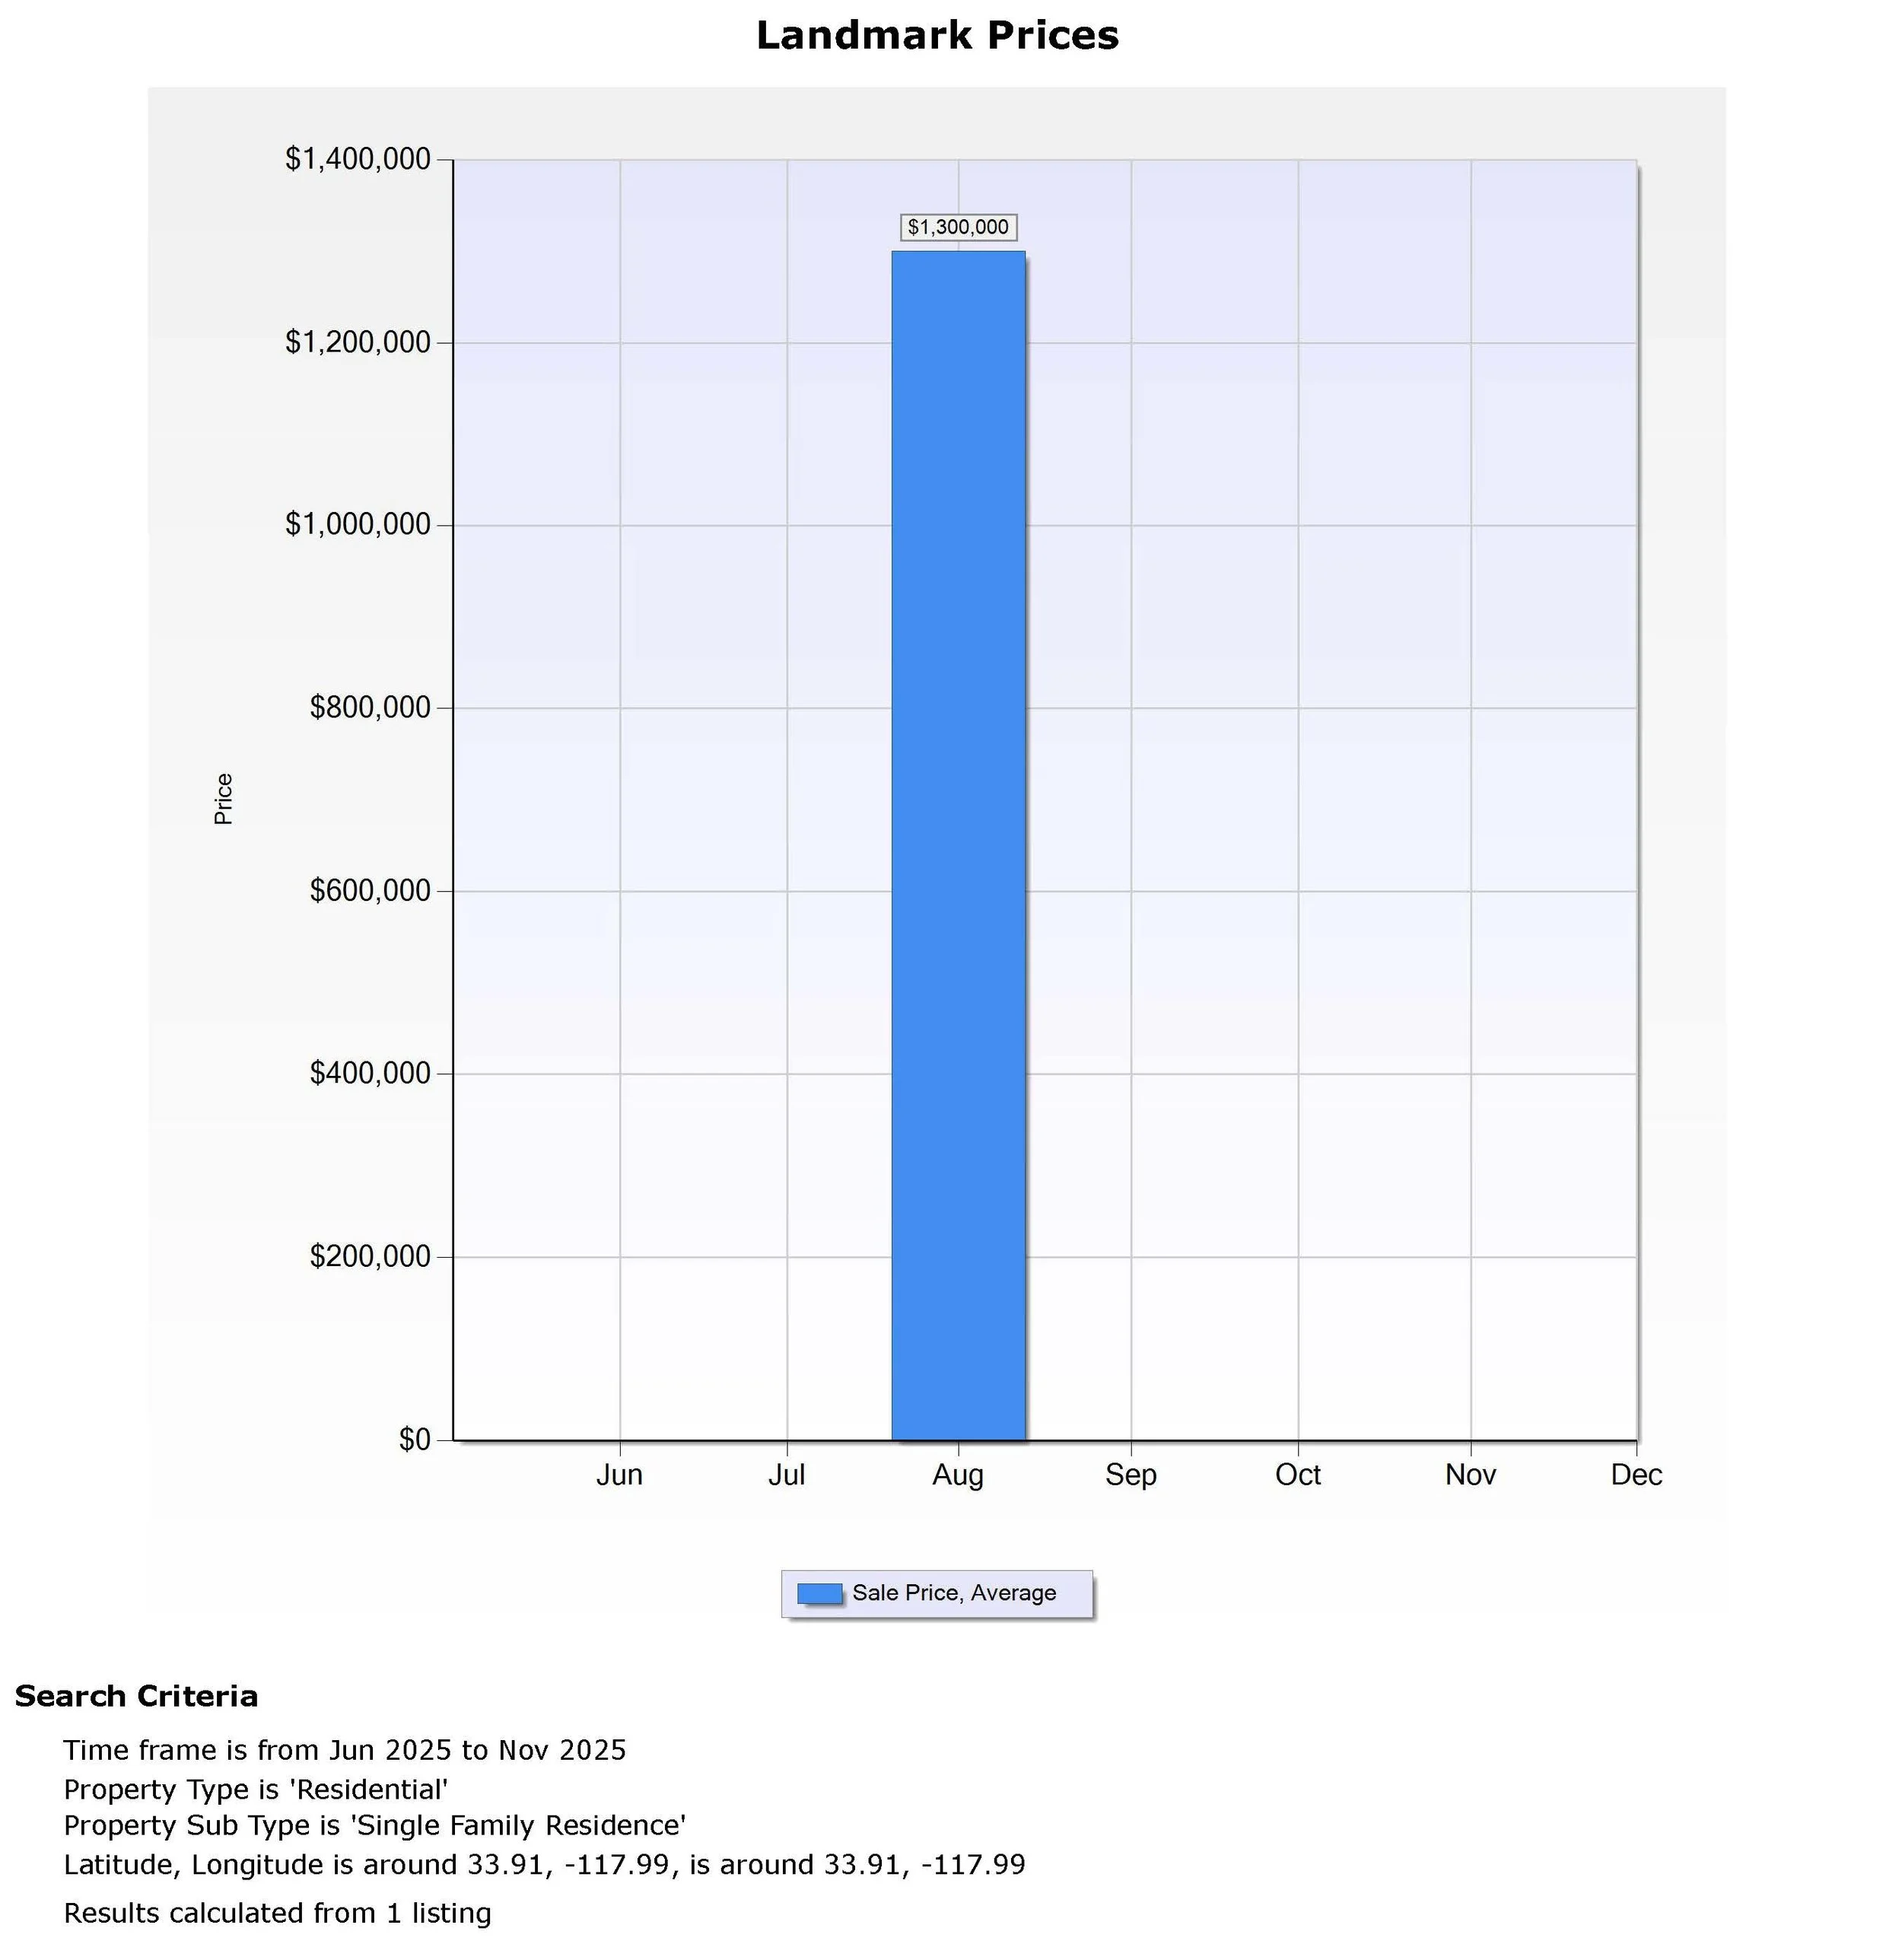
The table below lists the prices used in the Landmark analysis over the past six months.

Landmark Six-Month Price Graph
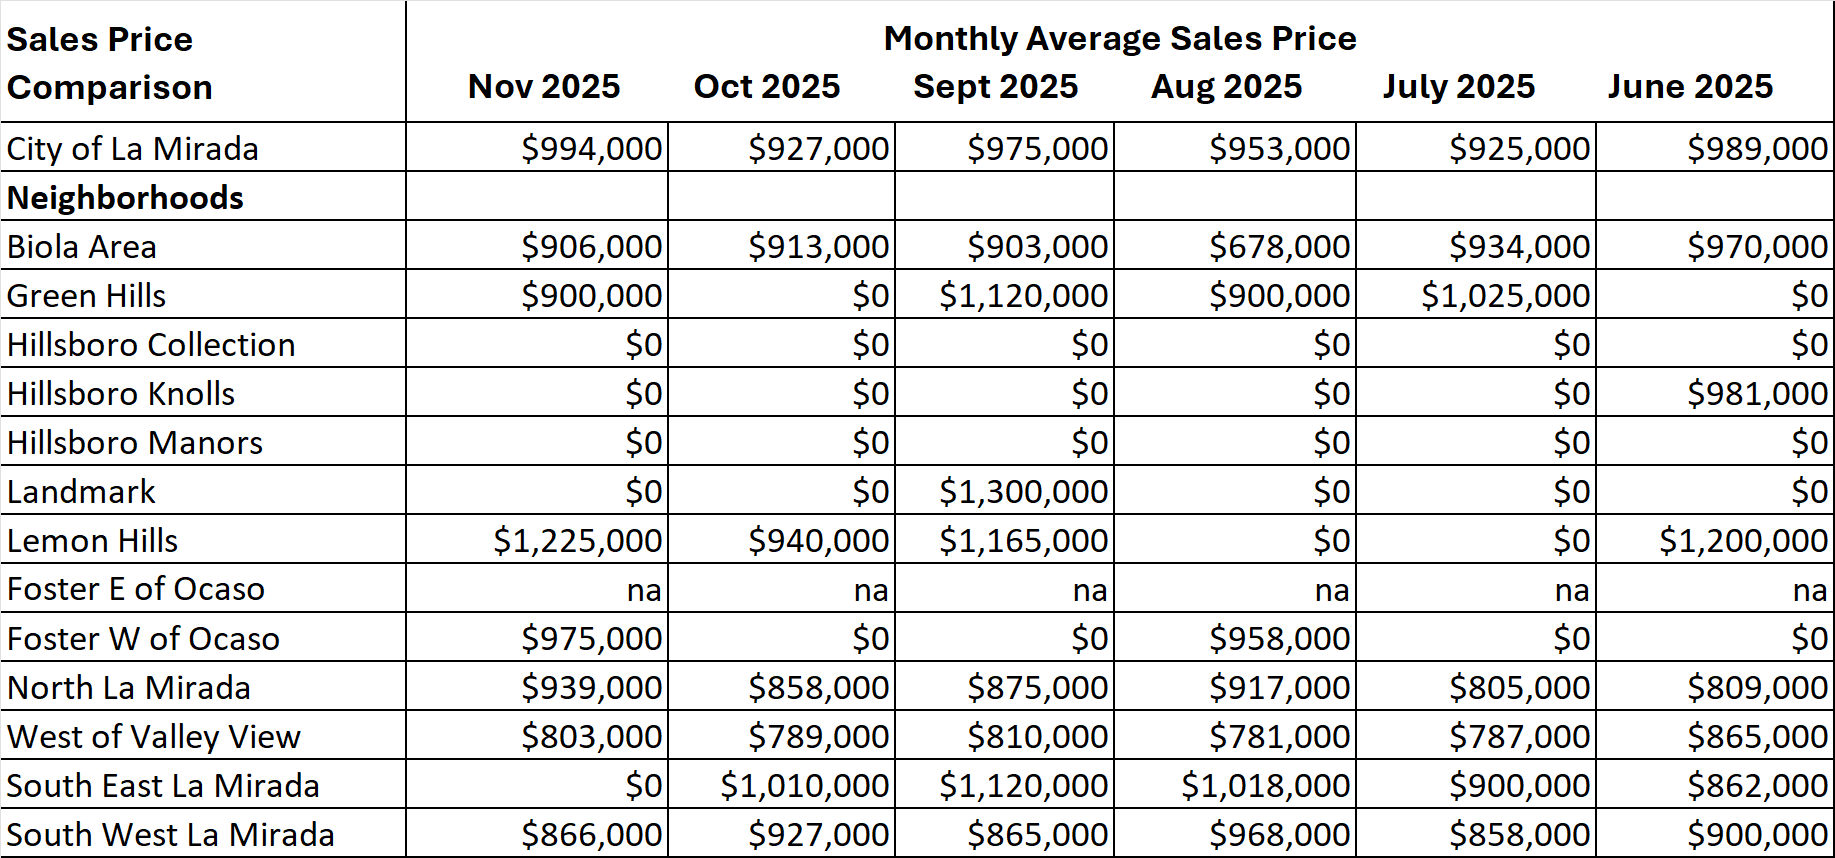
Landmark compared to the city of La Mirada and other La Mirada neighborhoods
Here is a way for you to track how the city and your neighborhood have progressed over the last six months and to see how other neighborhoods are progressing compared to yours.
$0 equals a month that had no sales in that month