

Q1 Market Report - Moonridge
Moonridge Area Market Trends: $0-$800,000 Price Range
Like most of Big Bear, I have broken up the Big Bear Moonridge Area Market into two segments - Up to $800,000 property value and the luxury market over $800,000. This seems to be the most accurate price range to split the market. Every three months, I will post detailed quarterly market trend graphs for each price range with a condensed but easy to understand examinations of market stats. At the conclusion of our market report there will be a total market summary.
Graph 1 (below) shows what residential real estate price changes have occurred for the Moonridge Area on a monthly basis using a parameter of: Price Range $0 - $800,000, from January 2020 to March of 2022.
In the Moonridge area, the first quarter of 2022 continued with price increases that we have been enjoying since January of 2020. What started out as the average price of $422,000 in January of 2020, has brought us to an average price of $655,000 in March of 2022. A total increase of $233,000. Which is a nice increase. When compared to the Big Three of Total Big Bear Valley coming in at an overall increase of $215,000 with a March 2022 average price of $534,000 and Big Bear Lake Area coming in at an overall increase of $187,000 with a March 2022 average price of $622,000, and Big Bear City coming in at an overall increase of $310,000 with a March 2022 average price of $535,000. We can see that at $655,000 for 3/22 the Moonridge Area has a higher average price than The Big Three and an increase in price of $233,000 for the time period we are looking at that brings it in second among The Big Three. Also when we compare Moonridge with other areas of Big Bear, Moonridge is tied with the Lake Front Area for second place with an 3/22 average price of $655,000. They were only beat out by the Fox Farm area at 722,000

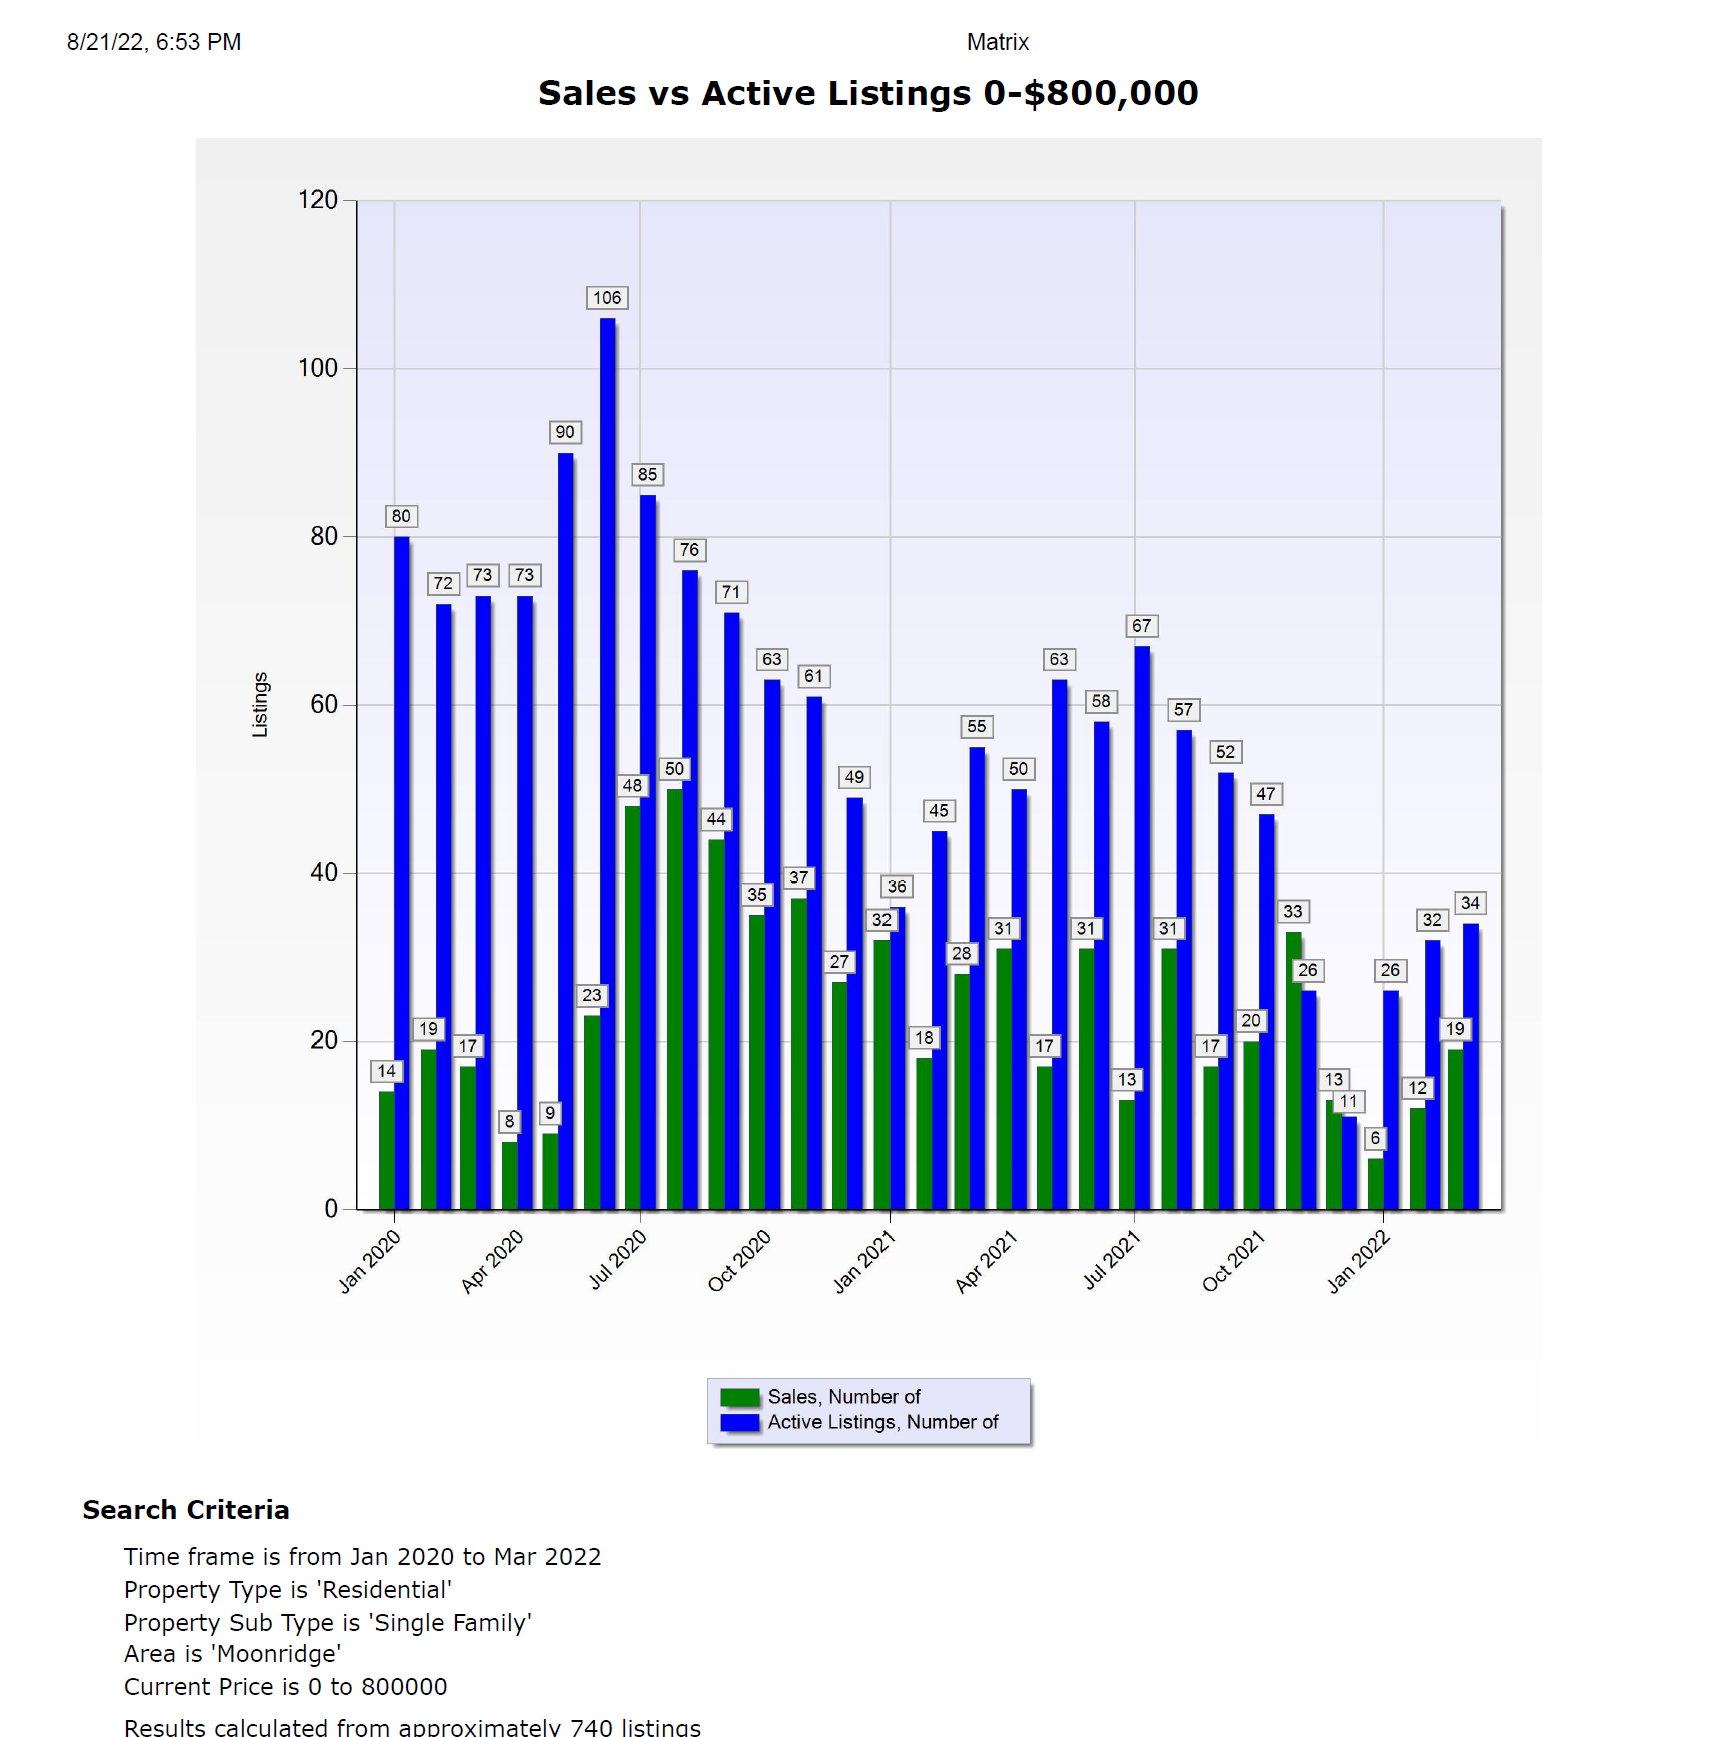
Graph 2 (below) shows what residential real estate inventory changes (Sales vs Active listings) have occurred for the Moonridge Area on a monthly basis using a parameter of: Price Range of $0 - $800,000 from January 2020 to March of 2022.
The graph below shows us that one of the reasons for the increase in prices we have enjoyed the last 2 years is that the inventory of listings is down, especially from last year at this time which was a record low. This first quarter of 2022 we had 92 listings for the quarter with 37 sales while last year we had 136 listings with 78 sales in the first quarter. Compare the last two years with 2020 first quarter of 225 listings and you can see why the listing shortages have had such influence to the large price increases the last two years.
Graph 3 (below) shows what residential real estate sales strength is occurring (Sales vs Expiring listings) for the Moonridge area on a monthly basis using a parameter of: Price Range $0 - $800,000, from January 2020 to March of 2022.
In the 0-$800,000 market in the Moonridge area the sales to expired ratios are still good with sales and expired listings close to a 1:1 ratio. There will always be expired listings. And a 1:1 ratio is considered a good ratio for a stable market.

Summary
From the last three graphs we can say that the first quarter stayed strong in price increases and sales. If we had more listings we would have had more sales. For vacation homes this is very impressive market. In the 0-$800,000 market we should compare the Moonridge Area with The Big Three Areas of, Big Bear Lake, The total Big Bear Valley and Big Bear City. When we do so what becomes evident from these graphs is that the Moonridge Area would come out second vs the big three in price increase and first in average price for 3/22. The only area in Big Bear that would beat the Moonridge Area in average price is Fox Farm. So the Moonridge Area has done very well compared to the rest of Big Bear.
The first quarter stayed with the over heated market, but we now know that we are headed into a very different market. Read my post about the slow down, Selling In Today's New Market.
Economic data for the second quarter and beyond is all pointing to a slow down in the market.
My opinion is that we are going to witness a more normal market. In order to get to that normal market prices may come down a little. Cabins will be on the market a little longer. Sales will decline. Because of competition to sell and get the highest price it will even be more important to seek out an experienced agent who can understand the changes that are coming in the market and has the backing of a company with a strong proven marketing system.
Expect a lot of changes in the graphs for the second quarter and the rest of the year.
PRICE RANGE - $800,000 and Up
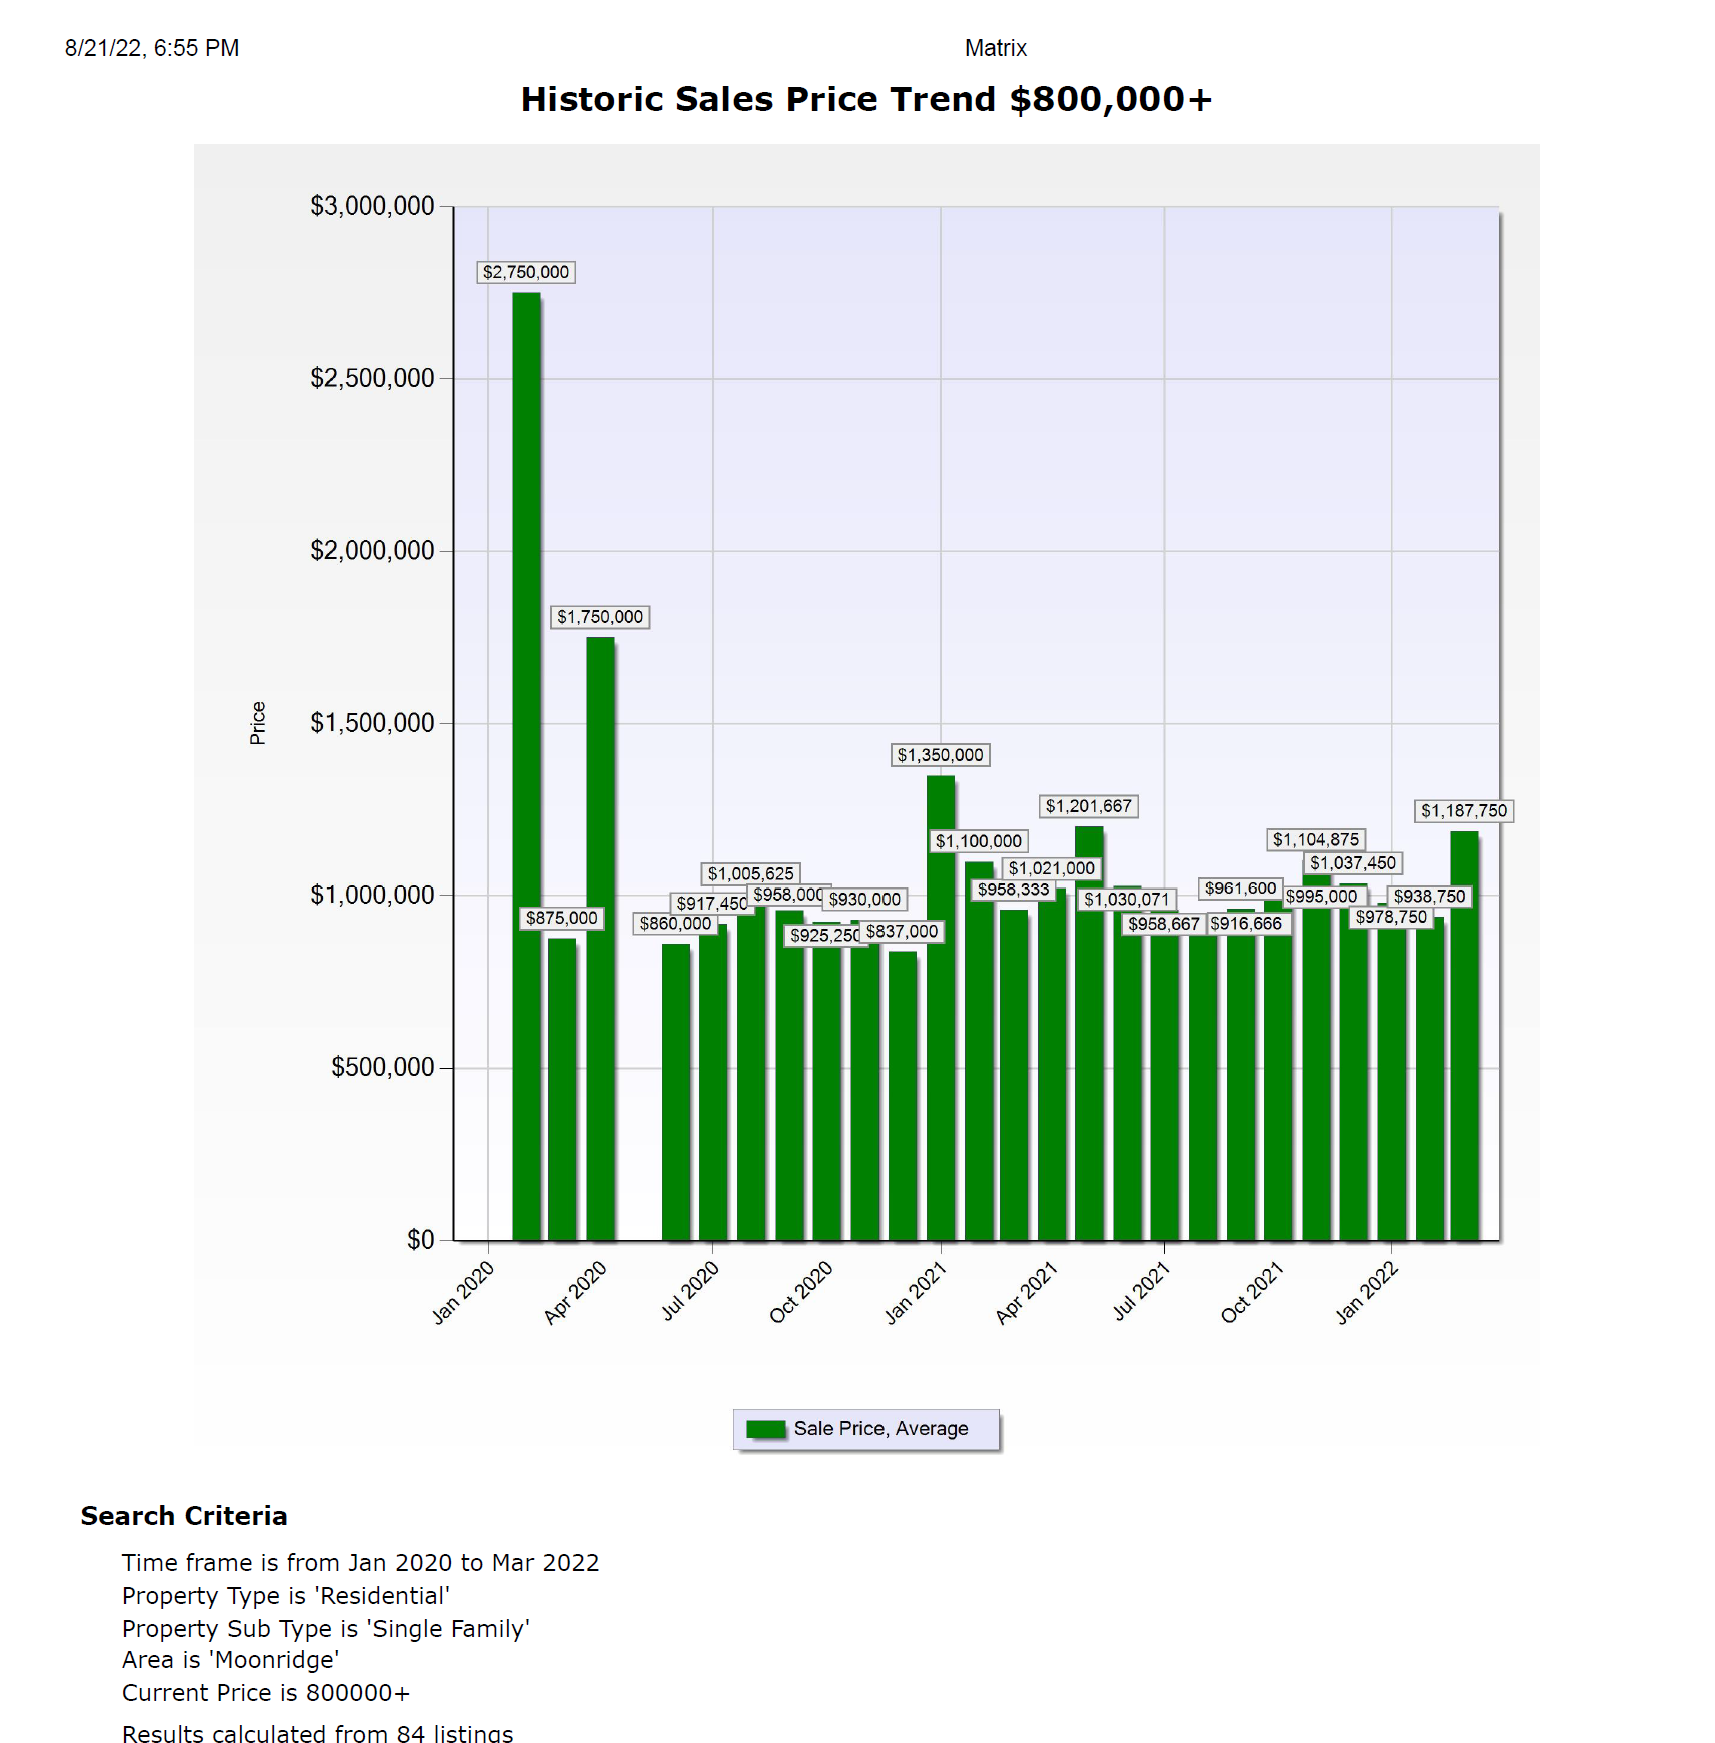
Graph 1 (below) shows what residential real estate price changes have occurred for the Moonridge area on a monthly basis using a parameter of: Price Range $800,000+, from January 2020 to March of 2022.
In the $800,000 and over market in the Moonridge Area the first quarter of 2022 continued with the stable prices that we have been enjoying since January of 2020. What started out with an average price in January of 2020, of $2,750,000 has brought us to an average price of $1,187,000 in March of 2022. For a decrease of $1,163,000. This doesn’t make since we know that prices have gone up or stayed stable. If we take a closer look at the graph we can see that prices have averaged around $1,100,000. This is typical in this price range. If you look at the graphs for this price range for the different areas of Big Bear you will see that the average prices are around $1,100,000 to $1,200,000. But you have to remember that this price range has wider price swings than the 0 - $800,000. By looking at the graphs you can see that we can have a month to month swing of $400,000 at different months.
This is why if you want to know what your Big Bear cabin is worth, you have to get a more detailed market analysis. That takes into consideration of Bedrooms, Bathrooms, Square Feet, Lot size, Condition and Views or location.
Graph 2 (below) shows what residential real estate inventory changes (Sales vs Active listings) have occurred for the Moonridge Area on a monthly basis using a parameter of: Price Range $800,000 and up, from January 2020 to March of 2022.
This quarter we had 34 listings and 14 sales. While last year we had 28 listings and 5 sales in the first quarter. Compare the last two years with 2020 first quarter of 15 listings and 2 sales and you can see that the luxury market has been getting stronger every year. This is partly because as prices have gone up we have had more cabins come into this price range. It is also worth noting that during 2019 and before we were lucky to have any sales in this price range in the Moonridge area in three months.

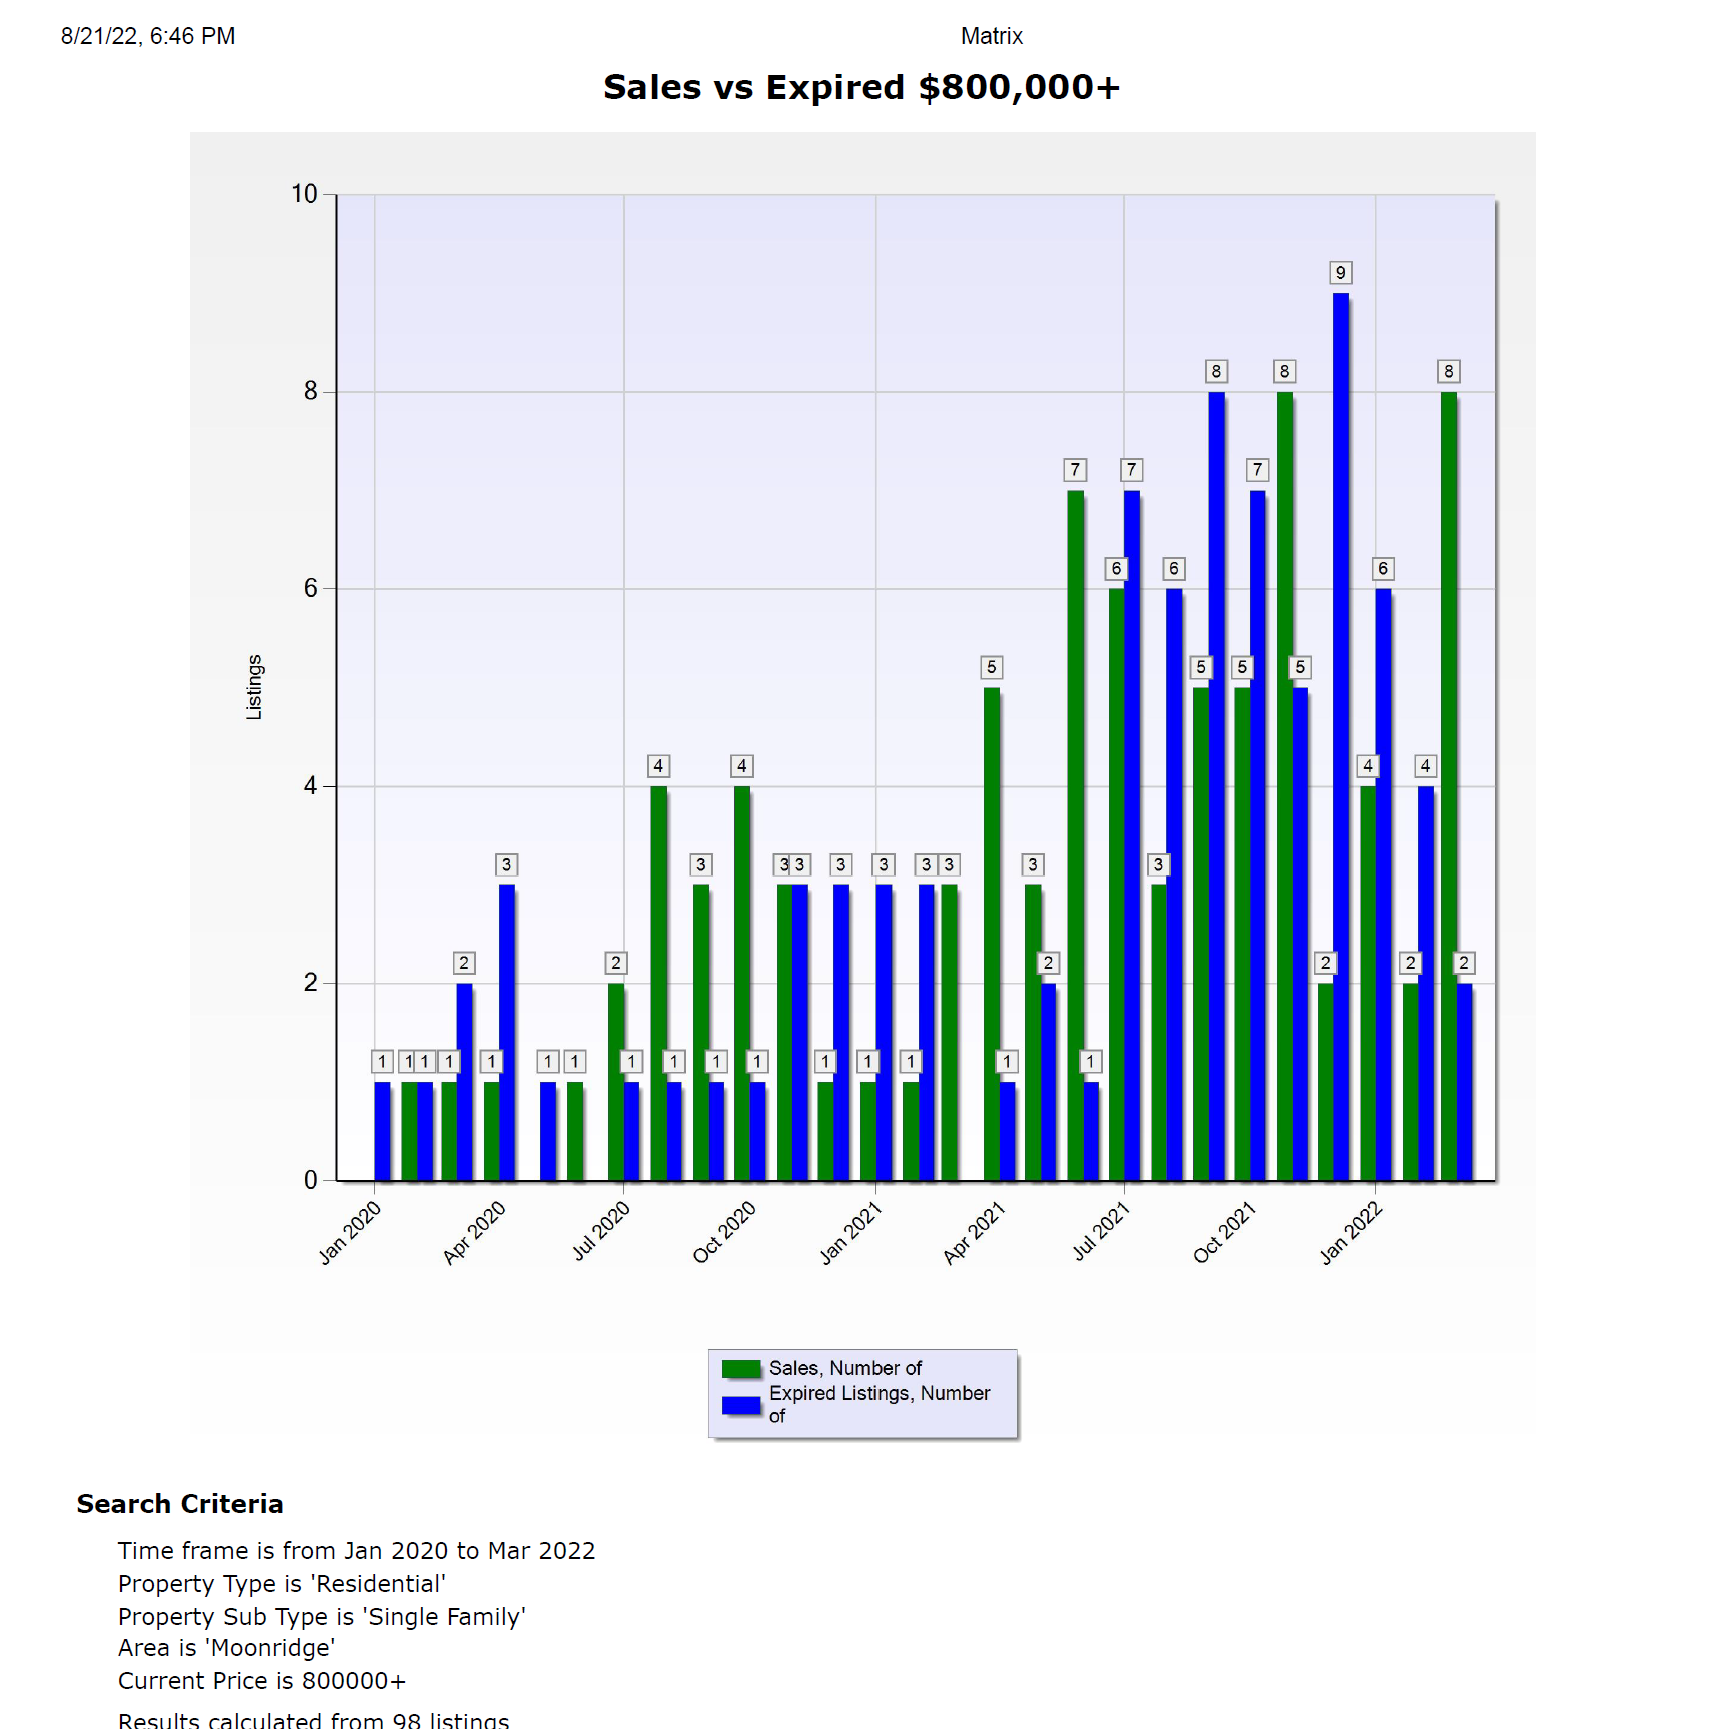
Graph 3 (below) shows what residential real estate sales strength is occurring (Sales vs Expiring listings) for Moonridge Area on a monthly basis using a parameter of: Price Range $800,000 and up, from January 2020 to March of 2022.
In the $800,000 and up market in the Moonridge area the sales to expired ratios are still good with sales and expired listings close to a 1:1 ratio. There will always be expired listings. And a 1:1 ratio is considered a ratio for a stable market.
Summary
With these numbers we can say that the first quarter stayed strong in price stability and sales. For vacation homes in a luxury market this is very impressive market. In the 0-$800,000 market we would compare the big three areas of Big Bear Lake, The total Big Bear Valley and Big Bear City. But in the luxury market I don’t use Big Bear City because of lack of sales in the $800,000 and up luxury market. So from what I can see the Moonridge area Luxury market is on par with the rest of the areas in Big Bear with steady prices and an increase in the amount of sales when we have additional listings.
For a market that was basically dead in 2019 this is great news.
The first quarter stayed with the over heated market, but we now know that we are headed into a very different market. Economic data for the second quarter and beyond is all pointing to a slow down in the market. Read my post about the slow down, Selling In Today's New Market
Expect a lot of changes in the graphs for the second quarter and the rest of the year.
My opinion is that we are going to witness a more normal market. In order to get to that normal market prices may come down a little. Cabins will be on the market a little longer. Sales will decline. Competition to sell and get the highest price will go back to using an experienced agent who can understand the changes that are coming in the market and has the backing of a company with a strong proven marketing background.