

Q2 Market Report- Moonridge
Moonridge Area Market Trends
Every three months, I will post detailed quarterly market trend tables made from three year graphs, for the Total Big Bear Area and 10 Sub Areas. Using the tables and graphs I will report the trends of Market Prices, Sales vs Active Listings, and Expired Listings and summarize what they mean to the current and future Total Big Bear Area and 10 Sub Areas Real Estate Markets. This section is for the Moonridge Area. The following analysis is a detailed but easy to understand examination of these market trends.
The following stats have 2 sections. Section 1 up to $800,000 property value and Section 2 $800,000 and up, the Luxury Market. This seems to be the most accurate price range to split the market. If you want to just get the short version of the market in the Moonridge Area, you can read the Overall Summary of both price ranges before section 1.
Section 1 notes: the Castle Glen, Eagle Knolls and Eagle Point/Eagle Point Estates Areas are not included in section 1 stats due to the fact that there aren’t any sales under $800,000 in these areas.
Section 2 notes: the possibility of wide swings in monthly and quarterly market prices in the $800,000 and up Luxury Market.
Up To $800,000 Overall Summary
Market Prices in the second quarter of 2024 there was a decrease in Price of $58,000 (-10%) in average monthly price compared to the average monthly price for the first quarter of 2024. There was also a decrease in price of $51,000 (-9%) from 1 year ago and a decrease in price of $27,000 (-5%) from 3 years ago.
Area Ranking The 2024 second quarter average monthly price of $560,000 gives the Moonridge Area a ranking of 2nd highest in price out of the 7 sub areas for this price range, for the Total Big Bear Market. We also see in this quarter the Moonridge Area has a $112,000 (+25%) higher average monthly price compared to the Total Big Bear average monthly price of $448,000.
Sales and Listings in the second quarter of 2024 there was a average monthly decrease in sales of 8 per month and a increase of 16 listings per month, compared to the first quarter of 2023. There was also a decrease of 8 Sales per month and a increase of 11 listings compared to 1 year ago. We also had a decrease of 8 sales per month and a increase of 16 listings per month compared to 3 years ago.
Expired Listings have been experiencing a ratio of 1:2 in the last 8 out of 9 months vs a 1:1 ratio which is another indicator of a weaking of this market.
These numbers show us that the economic influences of higher rates and inflation have affected prices, sales and listings in a negative way.
When looking at the data of the Moonridge Area the two big areas of market influence to watch are of course interest rates and the number of listings that come on the market. We just had a 1% drop in mortgage interest rates. Which is great news. The question is will this be enough to bring sales back up to a higher level which should at least keep Prices from going down further?
$800,000 And Up Luxury Overall Summary
Market Prices in the second quarter of 2024 there was an increase in Price of $21,000 (+2%) in average monthly price compared to the average monthly price for the first quarter of 2024. There was also a increase in price of $6,000 (+1%) from 1 year ago and a decrease in price of $103,000 (-11%) from 3 years ago.
Area Ranking The 2024 second quarter average monthly price of $941,000 gives the Moonridge Area a ranking of 9th highest in price out of the 10 sub areas for this price range, for the Total Big Bear Market. We also see in this quarter the Moonridge Area has a $354,000 (-27%) lower average monthly price compared to the Total Big Bear average monthly price of $1,294,000.
Sales and Listings in the second quarter of 2024 sales stayed the same at 2 per month and listings increased by 8 per month, compared to the first quarter of 2024. There was also a increase of 1 Sale per month and a increase of 12 listings compared to 1 year ago. We also had a decrease of 3 sales per month and a increase of 10 listings per month compared to 3 years ago.
Expired Listings the sales to expired ratios for the last two years have been at a good level with sales and expired listings at a 1:1 Ratio. Where a 1:1 ratio is considered a good ratio for a stable market.
These numbers show us that the economic influences of higher rates and inflation have had a major affect on prices, sales and listings in a negative way.
When looking at the data of the Moonridge Area the two big areas of market influence to watch are of course interest rates and the number of listings that come on the market. We just had a 1% drop in mortgage interest rates. Which is great news. The question is will this be enough to bring sales back up to a higher level which should at least keep Prices from going down further?
Section 1 Up To $800,000
Market Prices
Last Quarter Market Trends The 2024 average monthly price for the second quarter of $560,000 was down $58,000 from the 2024 first quarter average monthly price of $618,000.
1 Year Market Trends The 2024 average monthly price for the second quarter of $560,000 was down $51,000 from the 2023 second quarter average monthly price of $611,000.
3 Year Market Trends The 2024 average monthly price for the second quarter of $560,000. was down $27,000 from the 2022 second quarter average monthly price of $587,000.
Area Ranking The 2024 second quarter average monthly price of $560,000 gives the Moonridge Area a ranking of 2nd highest in price out of the 7 sub areas for this price range, for the Total Big Bear Market. We also see in this quarter the Moonridge Area has a $112,000 higher average monthly price compared to the Total Big Bear average monthly price of $448,000.
Total Big Bear Area $448,000
The sub areas ranked as follows:
Fox Farm $655,000
Moonridge Area $560,000
Big Bear Lake Area $513,000
Fawnskin Area $487,000
Lake Front Area $483,000
Snow Summit $482,000
Big Bear City Area $436,000
Price Summary These numbers shows us that compared to last quarter the economic influences of higher rates and inflation have affected prices in a negative way with prices down $58,000. When compared to 1 year ago prices are down $51,000. When compared to 3 years ago prices are down $27,000. We just had a 1% drop in mortgage interest rates. Which is great news. The question is will this be enough to at least keep Prices from going down further?
If you want to know what your Moonridge cabin is worth in this price range, contact me to get a more detailed market analysis that takes into consideration the number of Bedrooms, Bathrooms, Square Feet, Lot size, Condition, Views and location.


Sales vs Active Listings (supply and demand)
Last Quarter The second quarter of 2024 had average monthly sales of 4 per month. Which was a decrease of 4 sales per month when compared to the sales of 8 per month for the first quarter of 2024. The average number of listings per month for the second quarter of 2024 was 74 which is 30 per month more when compared to the 44 average monthly listings for the first quarter of 2024.
1 Year Average The second quarter of 2024 had average monthly sales of 4 per month. Which was a decrease of 9 sales per month when compared to the sales of 13 per month in the second quarter of 2024. The average number of listings per month for the second quarter of 2024 was 74 which is 11 per month more when compared to the 63 average number of listings for the second quarter of 2023.
3 Year Average The second quarter of 2024 had average monthly sales of 4 per month. Which was a decrease of 8 sales per month when compared to the sales of 12 per month in the second quarter of 2022. The average number of listings per month for the second quarter of 2024 was 74 which is 16 per month more when compared to the 58 average monthly listings for the second quarter of 2022.
Sales vs Active Listings Summary These numbers show us that compared to last quarter the economic influences of higher rates and inflation have affected sales and listings in a negative way with sales down 4 and listings up 30. When compared to to 1 year ago sales are down 8 and listings are up 11. When compared to 3 years ago sales are down 8 and listings are up 30. We just had a 1% drop in mortgage interest rates. Which is great news. The question is will this be enough to bring sales back up to a higher level?


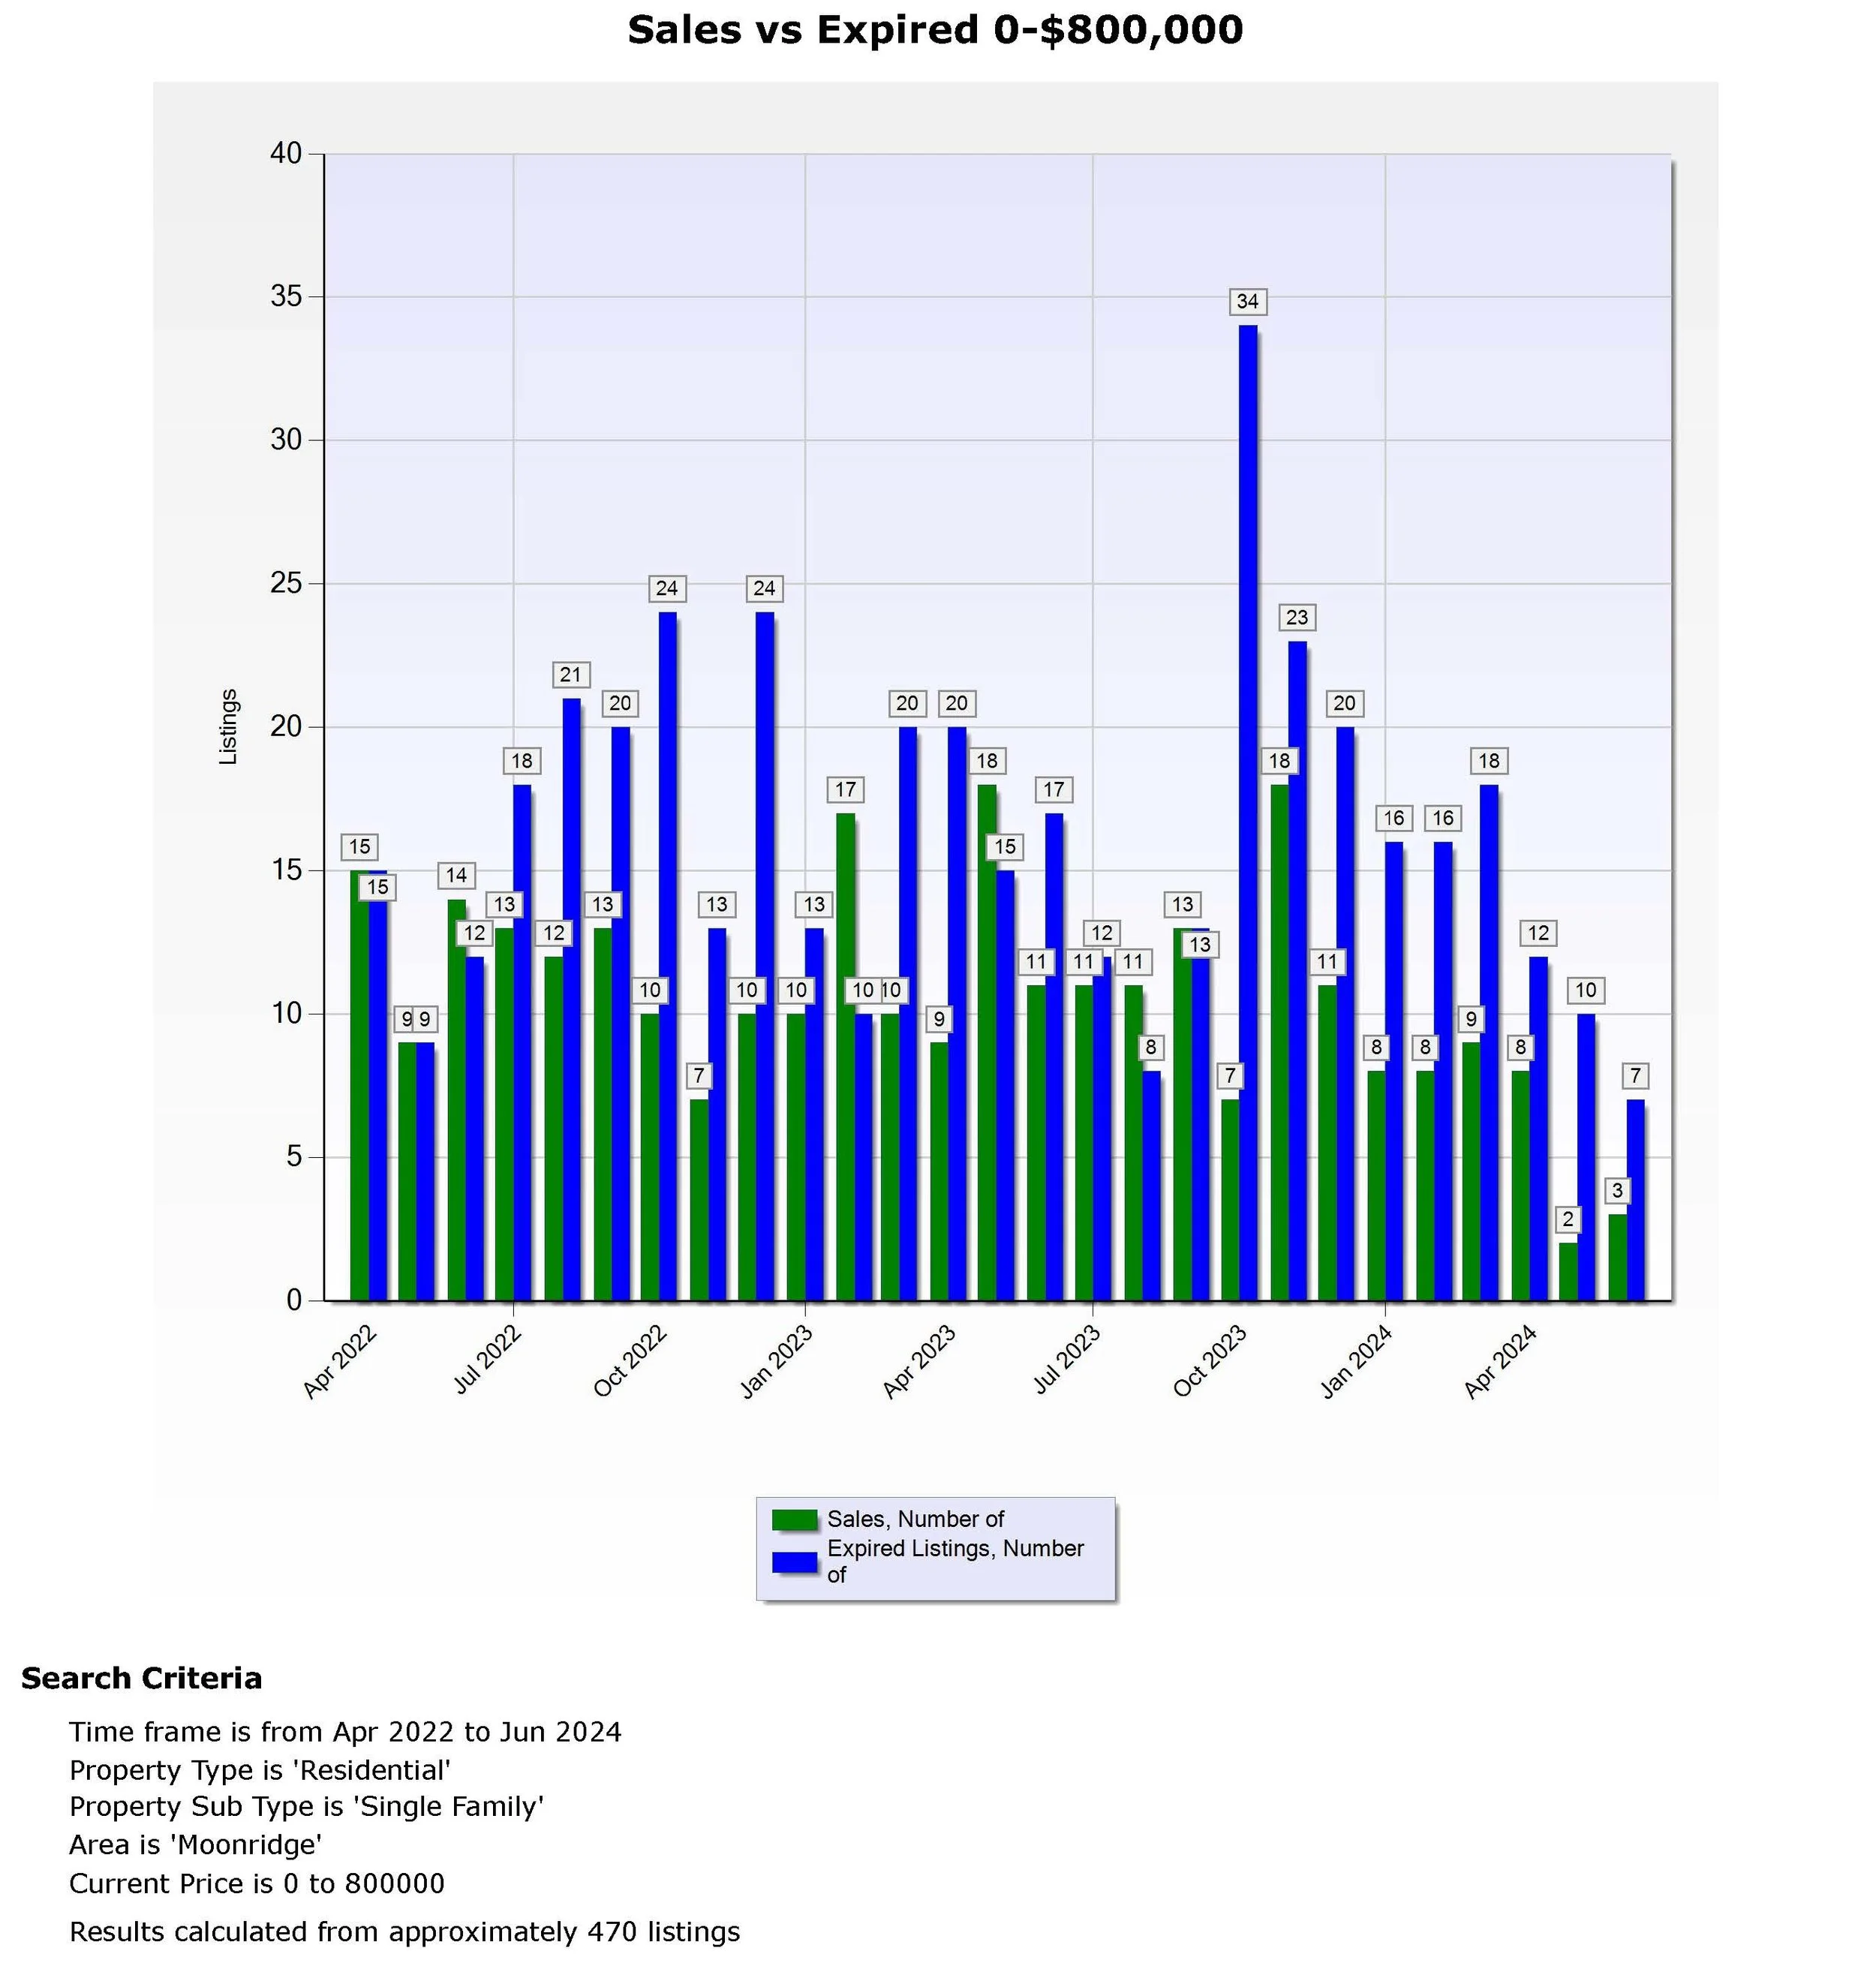
Sales vs Expired Listings (strength of sales)
Sales Vs Expired Market Trends Graph 3 In the Moonridge Area, the sales to expired ratios for the last two years have been at a good level with sales and expired listings at a 1:1 Ratio. Where a 1:1 ratio is considered a good ratio for a stable market. Now that we are staying in the 1:2 ratio like we have had for the last 8 out of 9 months it is an indicator that this market has entered into a declining market. We just had a 1% drop in mortgage interest rates. Which is great news. The question is will this be enough to bring sales back up to a higher level to reduce expired listings and keep us in a 1:1 ratio?
Section 2 $800,000 and up (Luxury Market)
Market Prices
Last Quarter Market Trends The 2024 average monthly price for the second quarter of $941,000 was up $21,000 from the 2024 first quarter average monthly price of $920,000.
1 Year Market Trends The 2024 average monthly price for the second quarter of $941,000 was up $6,000 from the 2023 second quarter average monthly price of $935,000.
3 Year Market Trends The 2024 average monthly price for the second quarter of $941,000 was down $103,000 from the 2022 second quarter average monthly price of $1,044,000.
Area Ranking The 2024 second quarter average monthly price of $941,000 gives the Moonridge Area a ranking of 9th highest in price out of the 10 sub areas for this price range, for the Total Big Bear Market. We also see in this quarter the Moonridge Area has a $354,000 lower average monthly price compared to the Total Big Bear average monthly price of $1,294,000.
Eagle Knolls didn’t have any sales this quarter.
Total Big Bear Area $1,294,000
The sub areas ranked as follows:
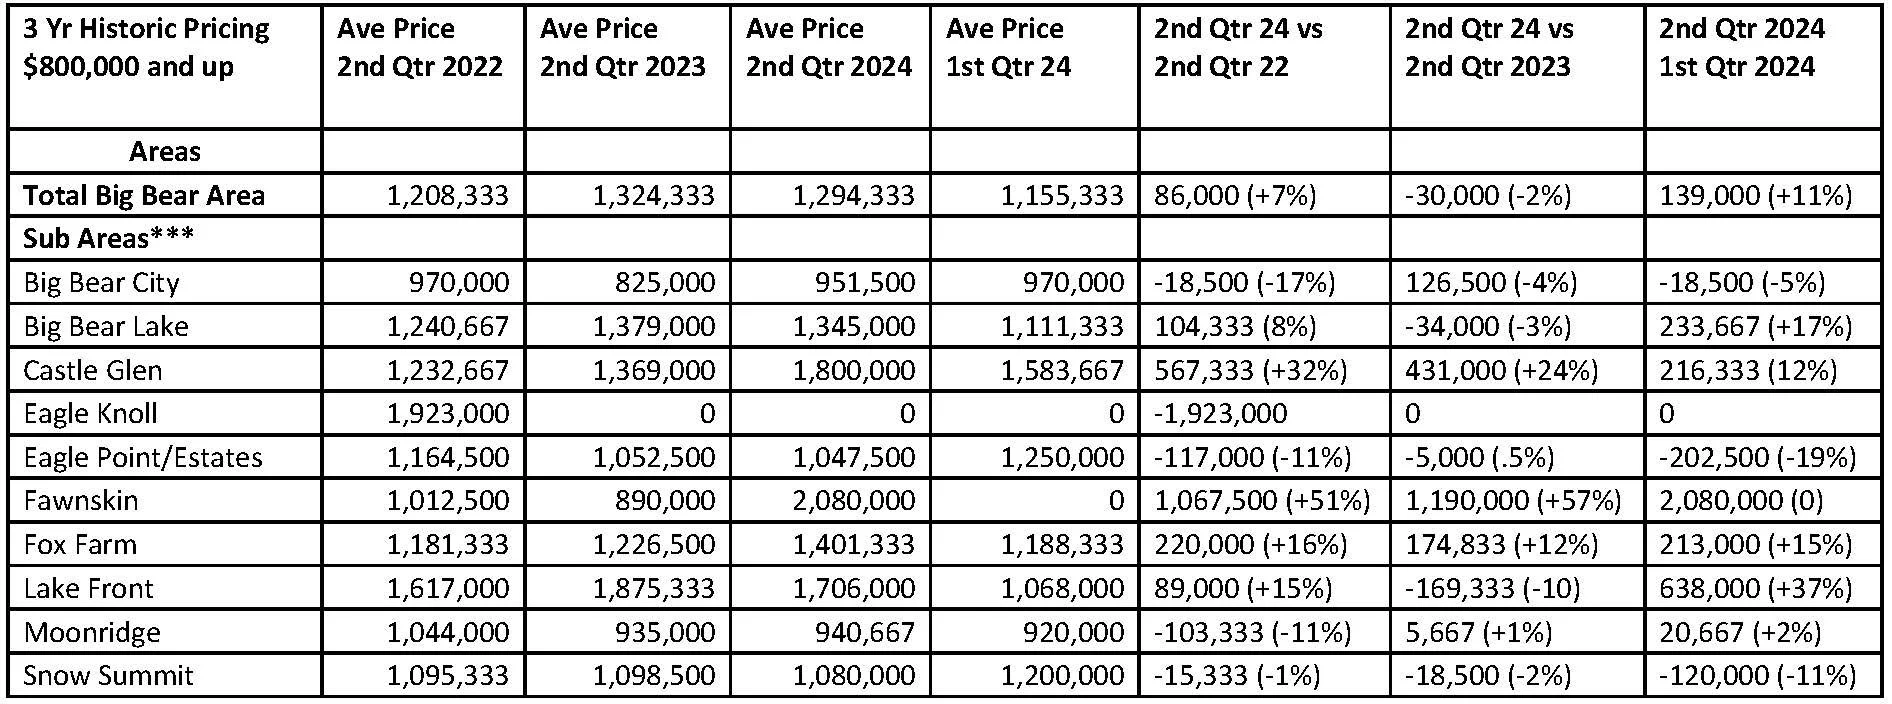
Fawnskin Area $2,080,000
Castle Glen Area $1,800,000
Lake Front Area $1,706,000
Fox Farm Area $1,401,000
Big Bear Lake Area $1,345,000
Snow Summit Area $1,080,000
Eagle Point/Estates $1,048,000
Big Bear City $952,000
Moonridge Area $941,000
Eagle Knolls $0
Price Summary These numbers shows us that compared to last quarter the economic influences of higher rates, inflation or a price swing have not affected prices in a negative way in the last year but has compared to 3 years ago with prices up $21,000 this quarter. When compared to 1 year ago prices are up $6,000. And when compared to 3 years ago prices are down $103,000. We just had a 1% drop in mortgage interest rates. Which is great news. The question is will this be enough to at least keep Prices from going down?
Remember the possibility of wide swings in monthly and quarterly market prices in the $800,000 and up Luxury Market. See the first graph below “Historic Sales Price Trend $800,000+”.
If you want to know what your Moonridge cabin is worth in this price range, contact me to get a more detailed market analysis that takes into consideration the number of Bedrooms, Bathrooms, Square Feet, Lot size, Condition, Views and location.


Sales vs Active Listings (supply and demand)
Last Quarter The second quarter of 2024 had average monthly sales of 2 per month. Which was the same as the 2 sales per month when compared to the first quarter of 2024. The average number of listings per month for the second quarter of 2024 was 23 which is a increase of 8 when compared to the 15 average monthly listings for the first quarter of 2024.
1 Year Average The second quarter of 2024 had average monthly sales of 2 per month. Which was a increase of 1 sales per month when compared to the sales of 1 per month in the second quarter of 2023. The average number of listings per month for the second quarter of 2024 was 23 which is 12 per month more when compared to the 11 average number of listings for the second quarter of 2023.
3 Year Average The second quarter of 2024 had average monthly sales of 2 per month. Which was a decrease of 3 sales per month when compared to the sales of 5 per month in the second quarter of 2022. The average number of listings per month for the second quarter of 2024 was 23 which is 10 per month more when compared to the 13 average monthly listings for the second quarter of 2022.
Sales vs Active Listings Summary These numbers show us that compared to last quarter the economic influences of higher rates and inflation have not affected sales and listings in a negative way with sales the same at 2 and listings up 8. When compared to to 1 year ago sales are up by 1 and listings are up 12. When compared to 3 years ago sales are down 3 and listings are up 11. We just had a 1% drop in mortgage interest rates. Which is great news. The question is will this be enough to keep sales at a higher level?
It is also worth noting that during 2019 and before we were lucky to have 2 or 3 sales in three months in this price range for the Total Big Bear Area market. Where in the second quarter of 2024 the Moonridge Area averaged 2 Sales per month.


Sales vs Expired Listings (strength of sales)
Sales Vs Expired Market Trends Graph 6 In the Moonridge Area, the sales to expired ratios for the last two years have been at a good level with sales and expired listings at a 1:1 Ratio. Where a 1:1 ratio is considered a good ratio for a stable market.
