

Q3 Market Report - Castle Glen
Castle Glen Market Trends: $800,000 And Over Price Range
The following stats are for the Castle Glen Area. I have divided the Total Big Bear Area into 10 Sub Areas to give you more detailed information on the area where your property is located. Like most of Big Bear, I have broken up the Big Bear City Market into two segments Up to $800,000 property value and the Luxury Market over $800,000. This seems to be the most accurate price range to split the market. Since there are no sales in the 0 - $800,000 market for Castle Glen I will only be reporting on the Luxury Market. Every three months, I will post detailed quarterly market trend tables and graphs for each price range with a condensed but easy to understand examinations of the market stats. If you want to just get the short version you can skip to the bottom and read the Summary.
Market Prices
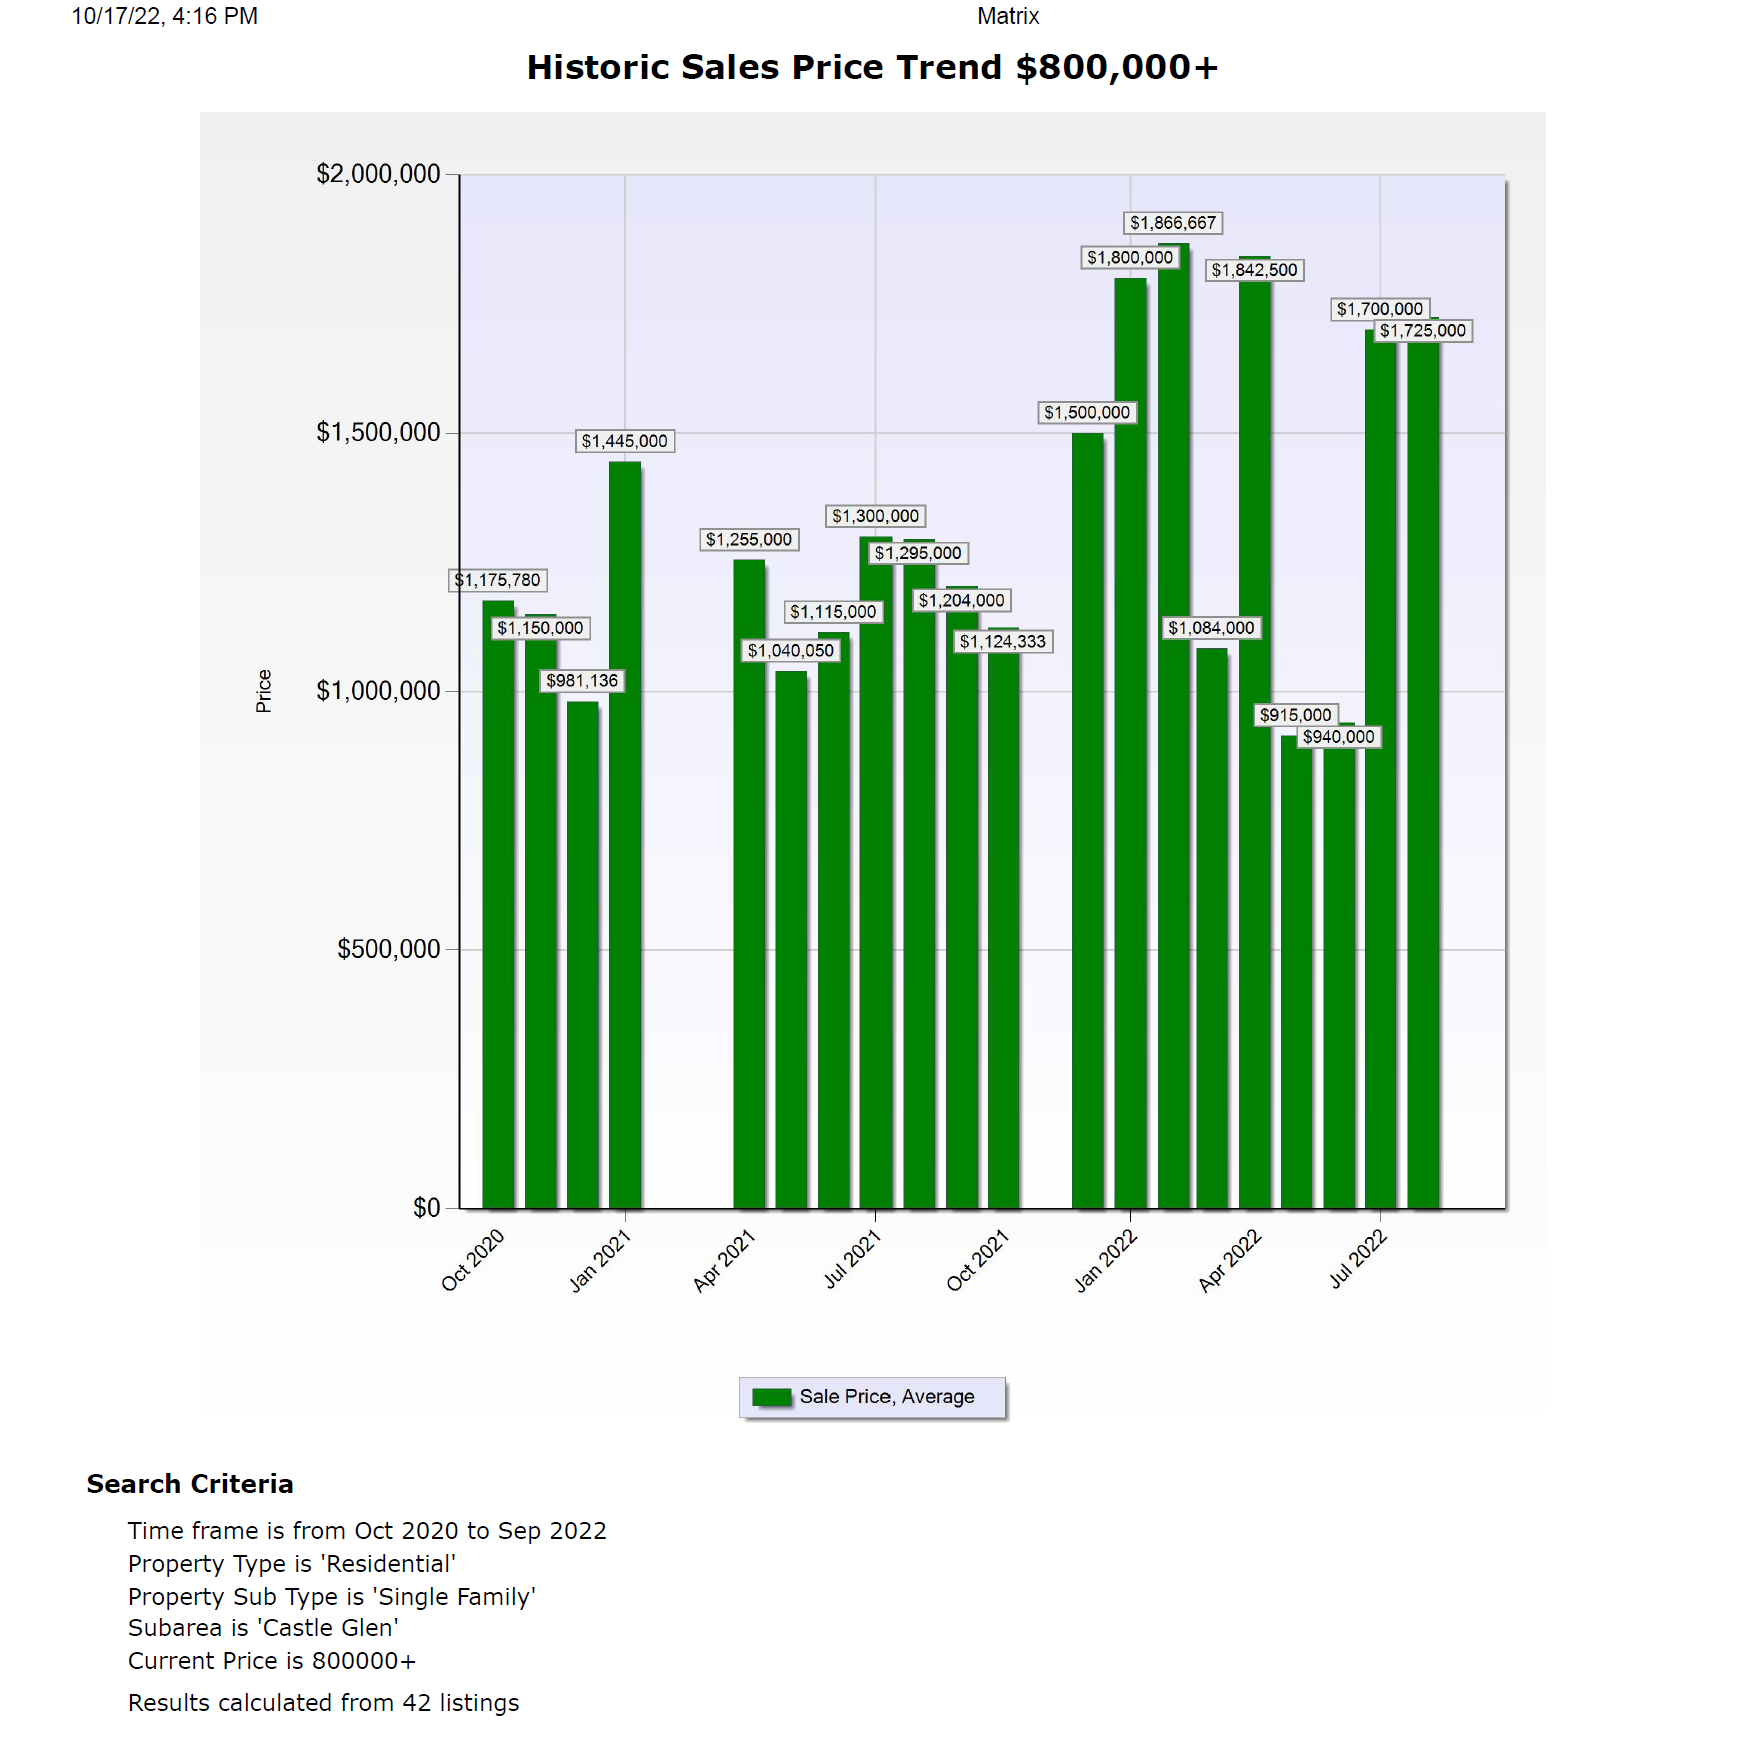
Table 1 (below) was created from the three year average price annual graphs for the Total Big Bear Area and the 10 sub areas from October 2020 to September 2022. Graph 1 below covers the Castle Glen Area. I will be using this table to analyze what is happening to the Real Estate prices in the $800,000 and up Luxury Market in the Castle Glen Area. The table and graphs have the parameters of: Price Range $800,000 and over, from October 2020 to September of 2022. Because of the volatility of the monthly numbers, which can have a difference of $400,000 or more each month, I will be using the annual averages for the $800,000 and up Luxury market to analyze how prices are changing in this price range in the Castle Glen area. I have also printed the monthly graph for Castle Glen (Graph 2) if you want to look at it. The Castle Glen Area area is a unique area with only 242 cabins. Because of it's size and the price range of the Cabins in that area statistically there isn't enough turn over to give us accurate information. But I will use the graphs to try and give us an idea of the Castle Glen Area. Remember that these are upscale custom homes where a view or furnishings can make a big difference in price. Each Cabin has to be analyzed on it's on merit.
In the Castle Glen area, so far in 2022 this area has continued with the price increase that it has been enjoying the last 3 years. What started out with an average price in 2020, of $1,075,000 brought us to $1,500,000 through the first three quarters of 2022. For an increase of $425,000. And the Castle Glen area has a $206,000 higher increase over the Total Big Bear Area. These two increases have brought the Castle Glen area to a ranking of 3 out of 10 areas in average price for 2022 so far. So overall you can see that the prices in the Luxury Market for Castle Glen have had a large increase the last few years, and is doing much better than the Total Big Bear Area and most of the sub areas overall. To see how the prices in the other sub areas have done for comparison please refer to Table 1 below or check out the write up on that area.
If you want to know what your Big Bear cabin is worth in this price range, contact me to get a more detailed market analysis that takes into consideration the number of Bedrooms, Bathrooms, Square Feet, Lot size, Condition and Views or location.


Sales vs Active Listings (supply and demand)
Table 2 shows what residential real estate inventory changes (Sales vs Active listings) have occurred for the Castle Glen area on a monthly basis. These stats are compiled from Graph 3 using a parameter of: Price Range of $800,000 and over from the 2-year period October 2020 to September of 2022.
You can see from the last 2 columns that sales are the same this quarter compared to last quarter and listings are up by 10. But when you look at this quarter compared to the third quarter last year sales are down by 1 in this quarter and listings are up by 13. This shows us that economic influences of higher rates and inflation haven’t affecter sales yet even with the increase in listings. Given the current economic conditions I would expect the number of listings to go up and sales to decline. This will also put pressure on prices to go down. Which is what you would expect in a declining market. It will be interesting to see if the pressure of so many listings finally start to drive the average amount of sales and price down. It is also worth noting that during 2019 and before we were lucky to have 2 or 3 sales in three months in this price range for the whole Big Bear market. So overall this market is still in good condition.


Sales vs Expired Listings (strength of Sales)
Graph 4 In the Castle Glen area, the sales to expired ratios have been at a good level. With sales and expired listings close to a 1:1 ratio for the past few quarters. There will always be expired listings. And a 1:1 ratio is considered a good ratio for a stable market. But in the last quarter we are seeing a 1:2 ratio of sales to expired listings which shows we are in a declining market that should drive prices down. Because there is so little data from this graph I would expect this ratio to change from quarter to quarter.

Summary
With these numbers we can say that the third quarter in the Castle Glen area still has a nice increase in prices that have preserved the equity build up in the cabins there for the last 3 years. Sales have stayed about the same, but listings and expired listings have started to go up. The nice part is that sales stayed at a good level. For vacation homes in a luxury market this is a neutral market for now. We will have to see how the influence of increased listings and expired listings affect this market.
We now know that we are headed into a very different market. Economic data for the fourth quarter and beyond is all pointing to a slowdown in the market.
Expect changes in the graphs for the fourth quarter to better reflect the economy.
My opinion is that we are going to witness a more normal market. In order to get to that normal market prices may come down a little more. Cabins will be on the market a little longer. Sales will decline.