

Q2 Market Report - Eagle Point & Estates
Eagle Point/Eagle Point Estates Market Trends
Every three months, I will post detailed quarterly market trend tables made from three year graphs, for the Total Big Bear Area and 10 Sub Areas. Using the tables and graphs I will report the trends of Market Prices, Sales vs Active Listings, and Expired Listings and summarize what they mean to the current and future Total Big Bear Area and 10 Sub Areas Real Estate Markets. This section is for the Eagle Point/Eagle Point Estates Area. The following analysis is a detailed but easy to understand examination of these market trends.
The following stats have 2 sections. Section 1 up to $800,000 property value and Section 2 $800,000 and up, the Luxury Market. This seems to be the most accurate price range to split the market. If you want to just get the short version of the market in the Eagle Point/Eagle Point Estates Area, you can read the Overall Summary of both price ranges before section 2.
Section 1 notes: the Castle Glen, Eagle Knolls and Eagle Point/Eagle Point Estates Areas are not included in section 1 stats due to the fact that there aren’t any sales under $800,000 in these areas.
Section 2 notes: the possibility of wide swings in monthly and quarterly market prices in the $800,000 and up Luxury Market.
$800,000 and up Luxury Market Overall Summary
Area Ranking The 2023 second quarter average monthly price of $1,048,000 for the one sale last quarter for the Eagle Point & Estates Area gives the Area a ranking of 7th highest in price out of the 10 sub areas for this price range, for the Total Big Bear Market. We also see in this quarter the Eagle Point & Estates Area has a $296,000 (-19%) lower average monthly price compared to the Total Big Bear average monthly price of $1,294,000.
When looking at the data of the Eagle Point & Estates Area the two big areas of market influence to watch are of course interest rates and the number of listings that come on the market. We just had a 1% drop in mortgage interest rates. Which is great news. The question is will this be enough to keep sales at a level which should at least keep prices from going down?
There isn’t A Section 1 For The Eagle Point & Estates Area
Section 2 $800,000 and up (Luxury Market)
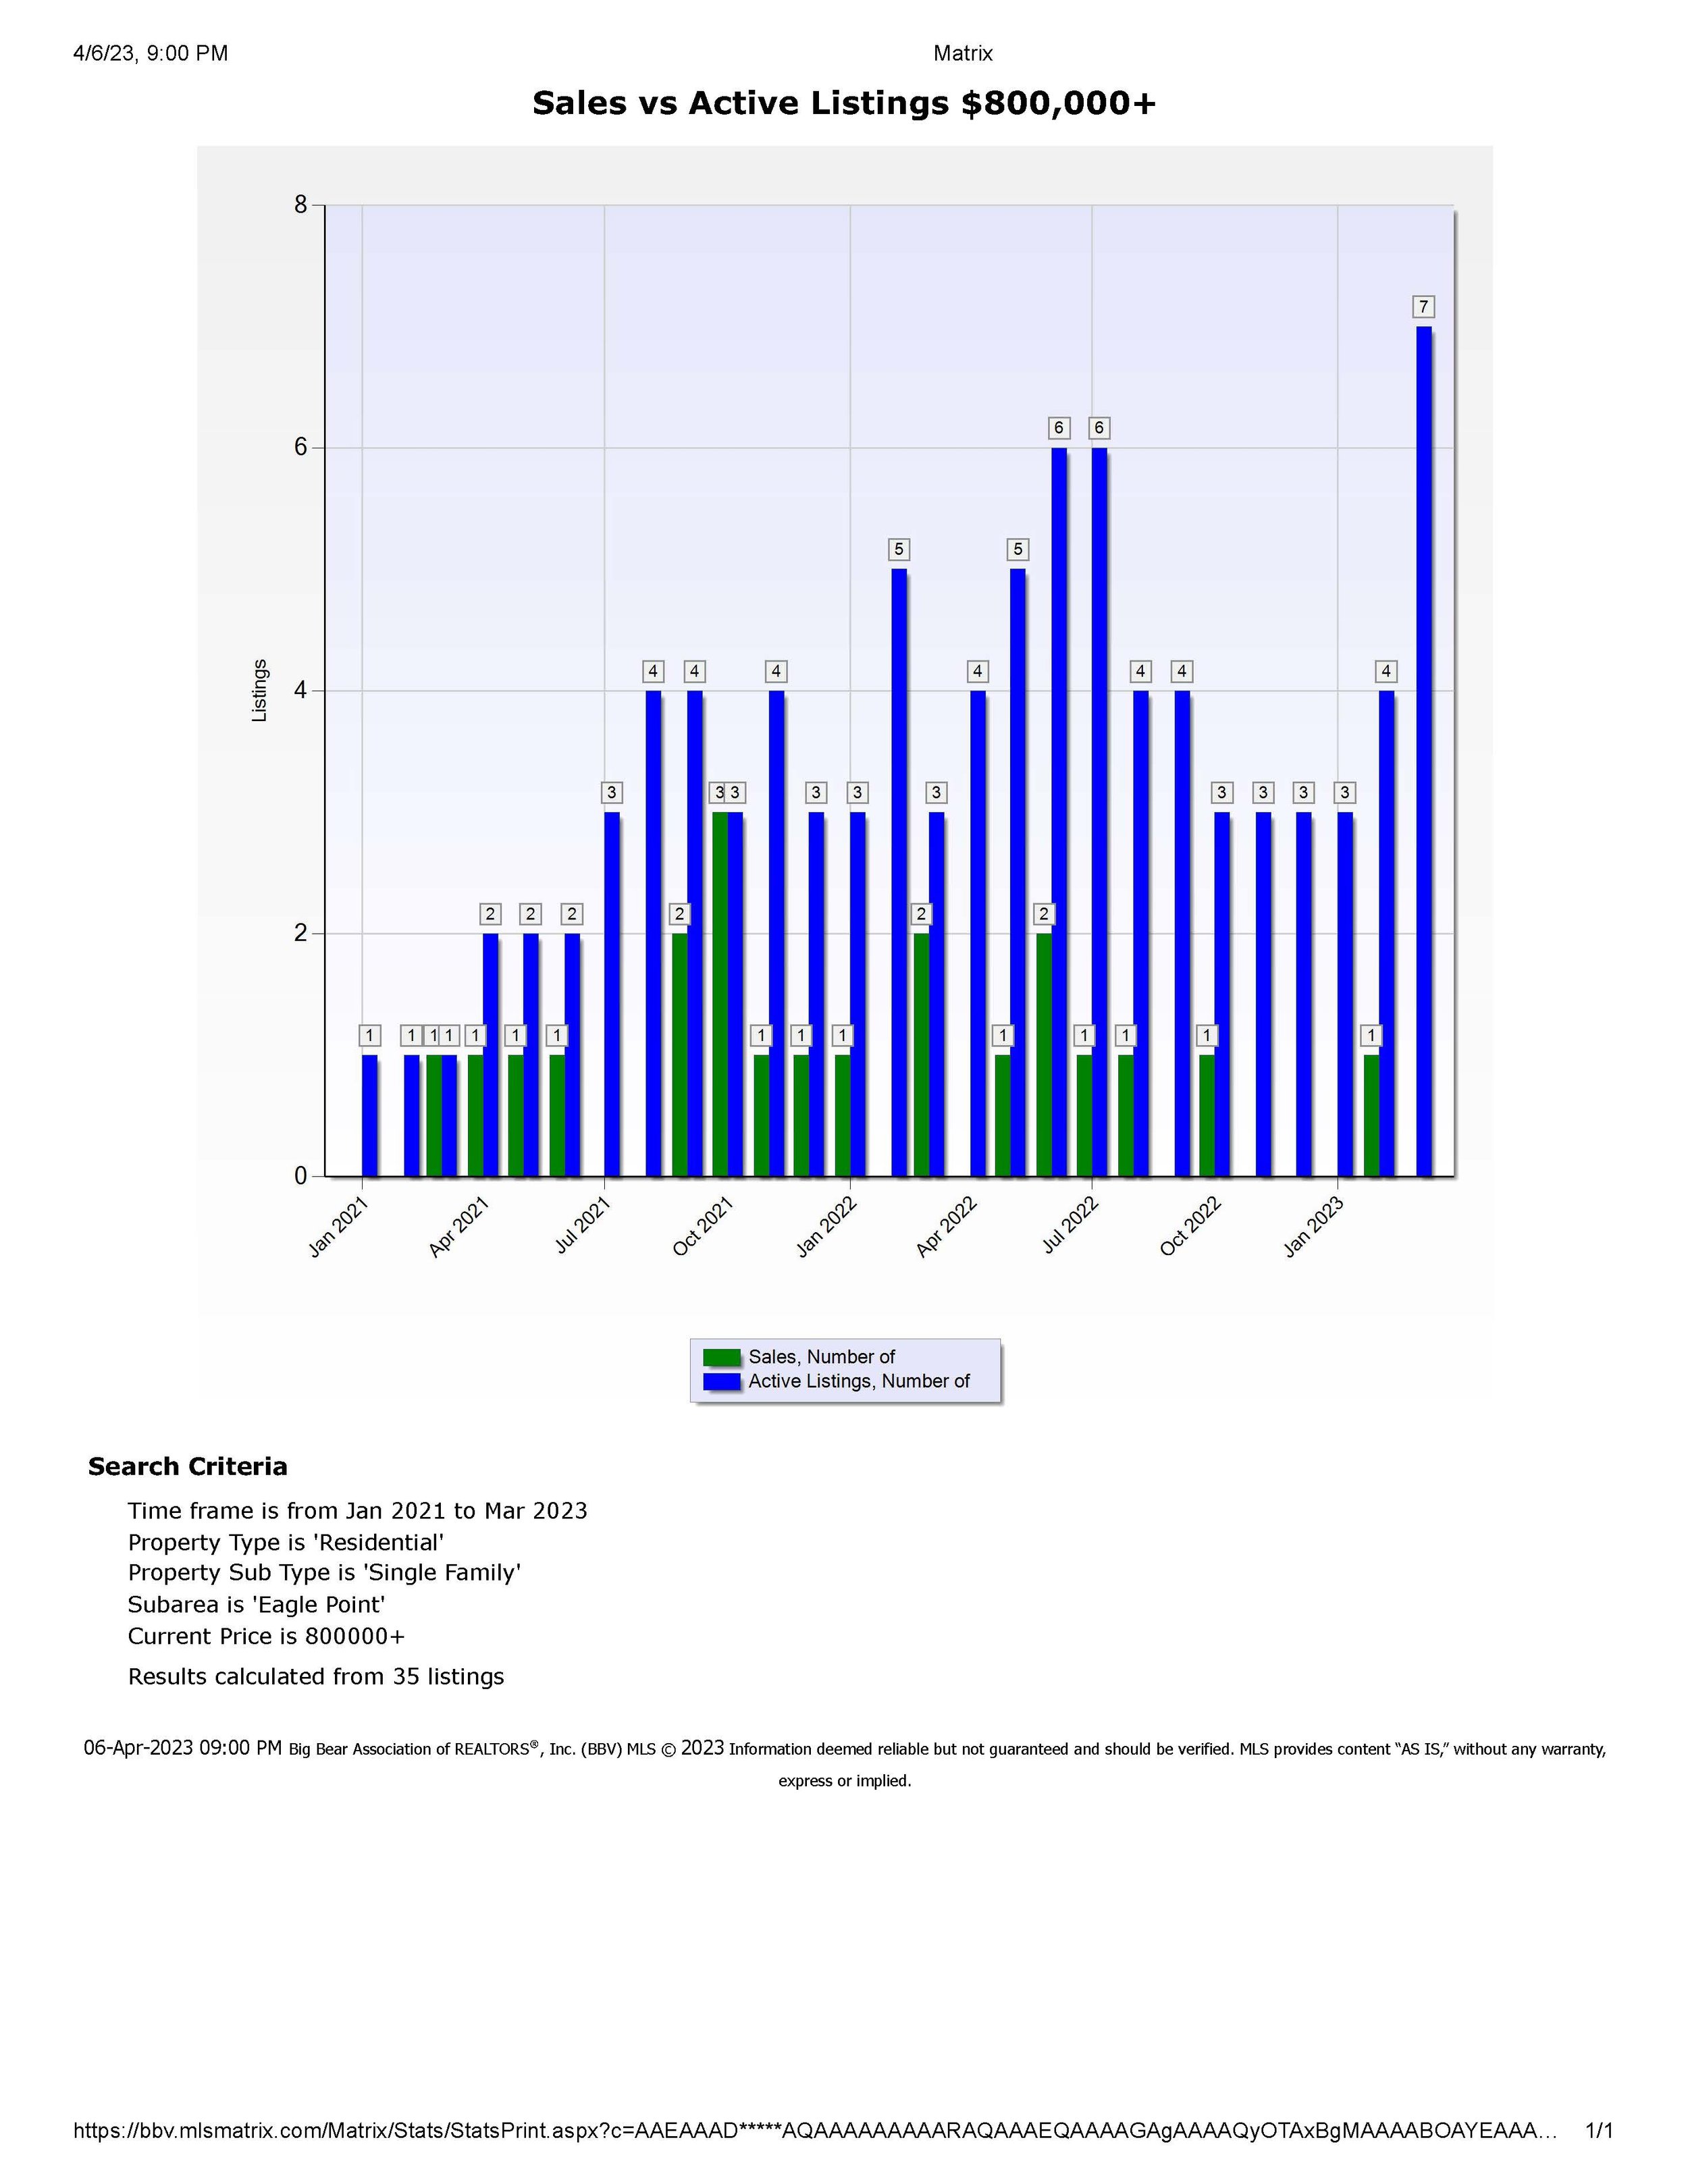
Because of the low amount of sales in the Eagle Point/Eagle Point Estates Area, there is statistically not enough turn over to give us accurate information on Market Prices, Sales (only 18 since January 2022) or Expired Listings. A better Market indicator would be the Total Big Bear Luxury Market Section 2. I posted the tables and graphs for you to look at if you want what little information is available to try and give you an idea of the Eagle Point/Eagle Point Estates Area. Remember that these are upscale custom homes where a view or furnishings can make a big difference in price. Each Cabin must be analyzed on it's on merit.
If you are thinking of selling a property in the Eagle Point/Eagle Point Estates Area contact me so I can use the Eagle Point/Eagle Point Estates Area information and the information from the other Big Bear Luxury Markets to give you a accurate price that your property would sell for on today’s market.
Market Prices
Eagle Knolls didn’t have any sales this quarter.
Total Big Bear Area $1,294,000
The sub areas ranked as follows:
Fawnskin Area $2,080,000
Castle Glen Area $1,800,000
Lake Front Area $1,706,000
Fox Farm Area $1,401,000
Big Bear Lake Area $1,345,000
Snow Summit Area $1,080,000
Eagle Point/Estates $1,048,000
Big Bear City $952,000
Moonridge Area $941,000
Eagle Knolls $0
Remember the possibility of wide swings in monthly and quarterly market prices in the $800,000 and up Luxury Market. See the first graph below “Historic Sales Price Trend $800,000 and up”.
If you want to know what your Eagle Point/Eagle Point Estates cabin is worth in this price range, contact me to get a more detailed market analysis that takes into consideration the number of Bedrooms, Bathrooms, Square Feet, Lot size, Condition, Views and location.


Sales vs Active Listings (supply and demand)
It is also worth noting that during 2019 and before we were lucky to have 2 or 3 sales in three months in this price range for the Total Big Bear Area market. Where in the fourth quarter of 2023 the Eagle Point/Eagle Point Estates Area averaged 1 Sale per month out of the total monthly average sales for the Total Big Bear Area Market of 13 in this price range.


Sales vs Expired Listings (strength of sales)
